Measurement made by Boris Gaillard the: 07-15 June 2001
Data
reduced by Fabrice Christen the: 27 June 2001
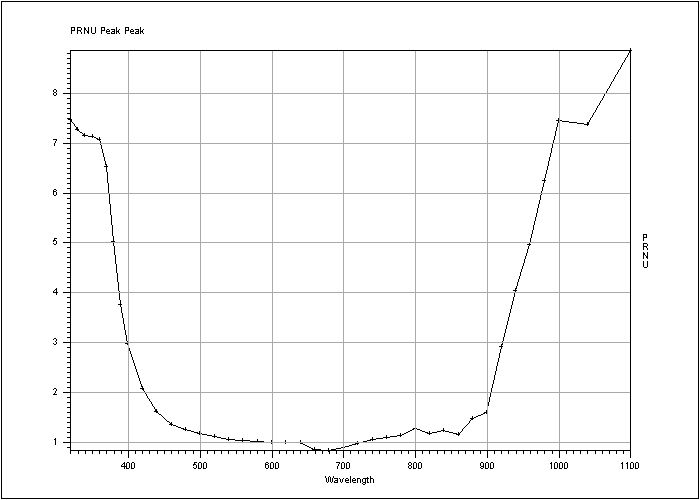
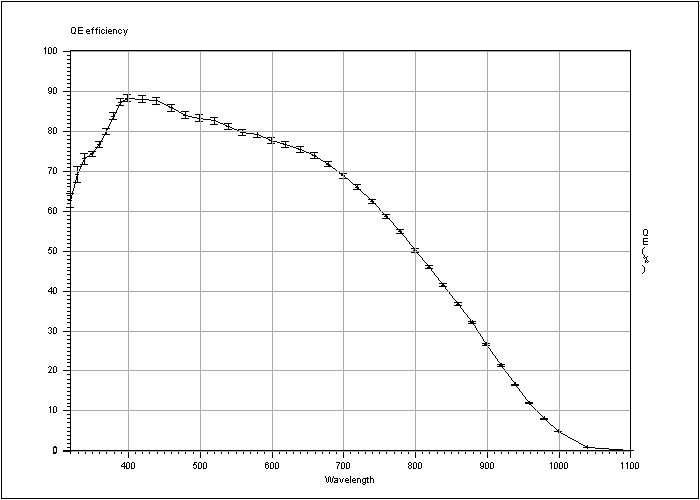
Clock mode: 225kpx/rr/HG/512
Conversion Factor=   1.177e-/ADU   ±0.00332      for 13691.9ADU
RMS noise        =   7.2013e-      ±0.1487

CCD temperature : -120.0Cº


Window area is : X1= 2210 X2= 4232 Y1= 8 Y2= 502
Bandwidth 5nm

Wav.       QE%                   PRNU rms%       Phase=
320        62.5     ±1.8         7.47            8.107697
330        69.1     ±2           7.26            8.07588
340        72.9     ±1.4         7.15            8.059834
350        74.1     ±0.73        7.12            8.056765
360        76.5     ±0.76        7.07            8.052922
370        79.8     ±0.79        6.52            7.970918
380        83.6     ±0.83        5.01            7.708336
390        87.1     ±0.89        3.76            7.426375
400        88       ±0.89        2.96            7.195299
420        87.9     ±0.89        2.07            6.84974
440        87.5     ±0.88        1.6             6.603393
460        64.5     ±0.65        1.35            6.438478
480        83.8     ±0.84        1.24            6.359287
500        83.1     ±0.83        1.17            6.300414
520        82.4     ±0.83        1.1             6.234828
540        81       ±0.82        1.05            6.192784
560        79.6     ±0.79        1.02            6.160523
580        78.9     ±0.79        1.01            6.16034
600        77.6     ±0.77        0.989           6.13718
620        76.6     ±0.75        0.976           6.123978
640        75.3     ±0.73        0.982           6.131029
660        73.7     ±0.71        0.84            5.970883
680        71.6     ±0.68        0.823           5.952052
700        68.7     ±0.64        0.888           6.026818
720        65.8     ±0.6         0.957           6.101561
740        62.3     ±0.57        1.04            6.179947
760        58.5     ±0.52        1.08            6.206456
780        54.7     ±0.48        1.12            6.251885
800        50       ±0.43        1.27            6.384276
820        45.9     ±0.39        1.17            6.301537
840        41.4     ±0.35        1.22            6.336483
860        36.6     ±0.31        1.15            6.278702
880        31.9     ±0.26        1.46            6.476734
900        26.5     ±0.21        1.6             6.615499
920        21.3     ±0.17        2.91            7.198289
940        16.5     ±0.13        4.04            7.472676
960        11.8     ±0.09        4.95            7.606612
980        7.88     ±0.06        6.24            7.878669
1000       4.67     ±0.035       7.45            7.985302
1040       0.782    ±0.0058      7.37            8.044858
1100       0.096    ±0.00071     8.85            8.315915
Table 1: Measurement of the Quantum Efficiency.
Figure 1: Graphic representation of the QE.
Figure 2: Graphic representation of the PRNU.
In this section you can compare the QE we measured with the testbench and:
QE Minimum specification
Typical QE
QE from Marconi
|
|
|
|---|---|
Figure 3: Comparison between the QE measured by ESO, the QE measured by Marconi, ESO specification and minimum specification. |
Figure 4: Ratio between the ESO measurements and the ESO minimum specification. |
|
Special specification |
|||
|
Wavelength(nm) |
Minimum spec. (%) |
ESO measurements (%) |
Result |
|
350 |
50 |
78.69 |
OK |
|
400 |
80 |
87.64 |
OK |
|
650 |
80 |
73.3 |
Under the minimum spec. |
|
900 |
25 |
26.47 |
OK |
|
Conclusion: |
No, this CCD is not in the 25 %. |
||
Table 2: Minimum specification for 25 % of the CCDs.
|
Comparison QE ESO / QE Marconi |
|||||
|
Wavelength (nm) |
QE ESO (%) |
QE Marconi (%) |
Difference (Eso - Marc. %) |
Relative difference (Marconi as reference %) |
Ratio QE ESO / QE Marconi |
|
350 |
78.69 |
64 |
14.69 |
22.9 |
1.23 |
|
400 |
87.64 |
83.6 |
4.04 |
4.8 |
1.05 |
|
500 |
81.91 |
81 |
0.91 |
1.1 |
1.01 |
|
650 |
73.3 |
73.4 |
-0.1 |
-0.2 |
1.00 |
|
900 |
26.47 |
26.5 |
-0.03 |
-0.1 |
1.00 |
Table 3: Difference and relative difference between ESO measurements and Marconi.
|
|
|
|---|---|
Figure 6: Graphic representation of the difference and the relative difference. |
Figure 7: Ratio between the ESO measurements and the Marconi measurements |
In this section you can compare the PRNU we measured at ESO and:
PRNU Minimum specification
PRNU from Marconi
|
|
|
|---|---|
|
Figure 8: Comparison between the PRNU measured by ESO, the PRNU measured by Marconi, and the maximum specification. |
Figure 9: Ratio between the ESO measurements and the Maximum specification. |
|
|
|
|
Figure 10: Graphic representation of the difference and the relative difference. |
Figure 11: Ratio between the ESO measurements and the Marconi measurements. |
|
Comparison QE ESO and QE Marconi |
||||||
|
Wavelength (nm) |
PRNU ESO (rms %) |
Maximum spec. |
PRNU Marconi |
Difference (Marc – ESO) |
Relative difference (Marc. as reference) |
Ratio PRNU ESO / PRNU Marconi |
|
320 |
7.47 |
6 |
/ |
/ |
/ |
/ |
|
350 |
7.12 |
5 |
5.8 |
-1.32 |
22.76 |
1.23 |
|
400 |
2.96 |
2.5 |
2.3 |
-0.66 |
28.7 |
1.29 |
|
500 |
1.17 |
2 |
1 |
-0.17 |
17 |
1.17 |
Table 4: Difference and relative difference between ESO measurements and Marconi.
In this section you will see the if the values we have measured for the QE and the PRNU are in accordance with the contract.
|
Wavelength (nm) |
Qe |
PRNU |
|
320 |
OK |
Outside the maximum specification |
|
340 |
OK |
|
|
350 |
OK |
Outside the maximum specification |
|
360 |
OK |
|
|
380 |
OK |
|
|
400 |
OK |
Outside the maximum specification |
|
450 |
OK |
OK |
|
500 |
Below the minimum specification |
OK |
|
550 |
Below the minimum specification |
|
|
600 |
Below the minimum specification |
|
|
650 |
Below the minimum specification |
|
|
700 |
OK |
|
|
750 |
OK |
|
|
800 |
OK |
|
|
850 |
OK |
|
|
900 |
OK |
|
|
950 |
Below the minimum specification |
|
|
1000 |
Below the minimum specification |
|
Table 5: Comparison between the values we have measured and the specifications in the contract.
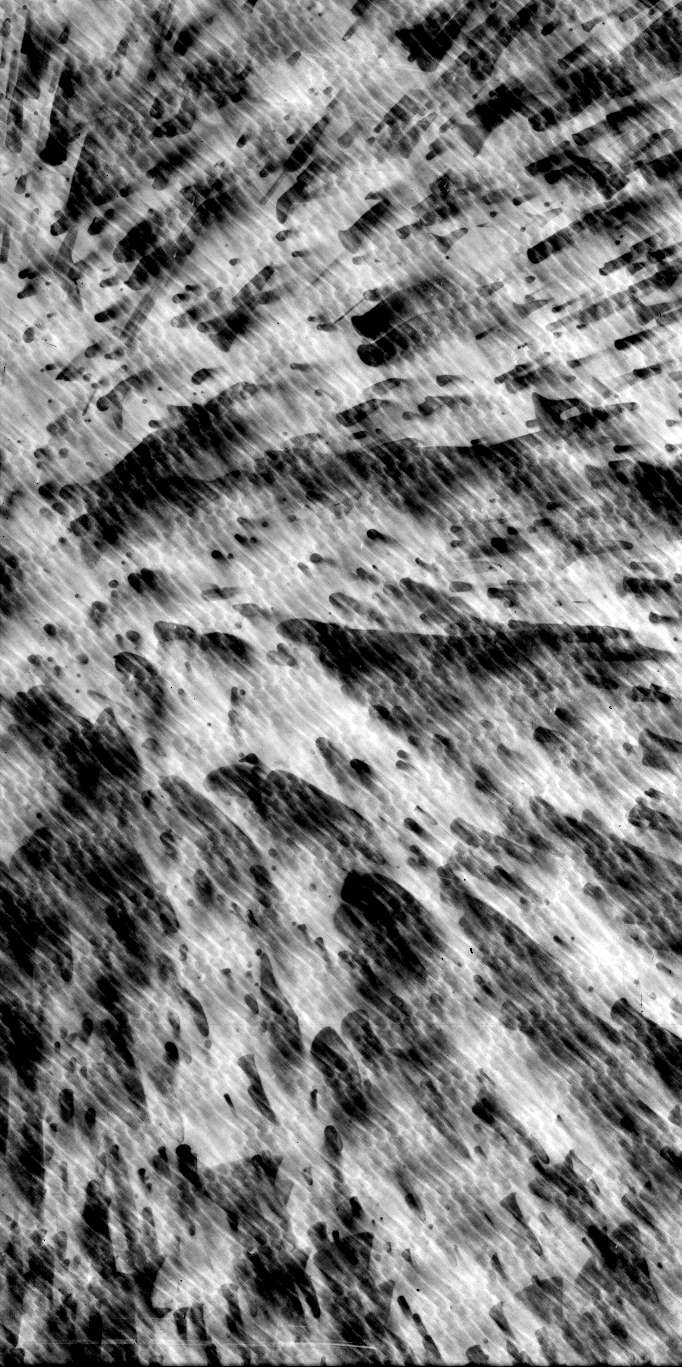
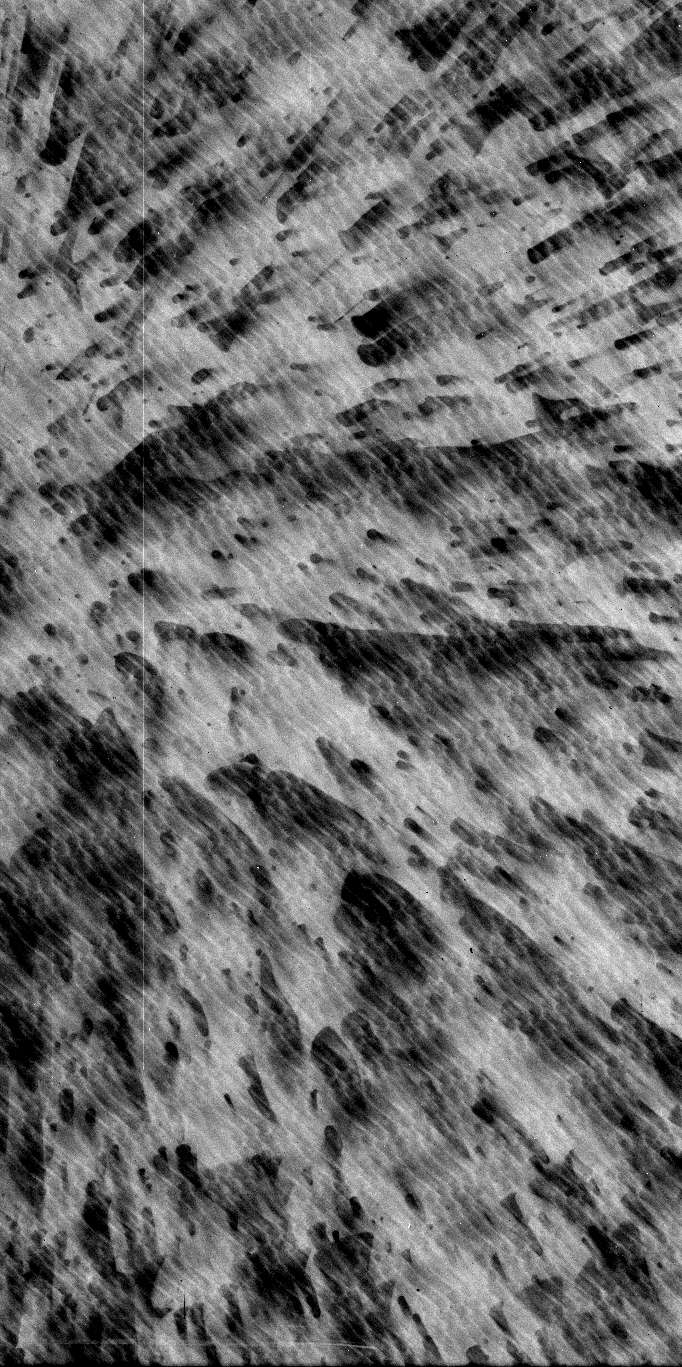
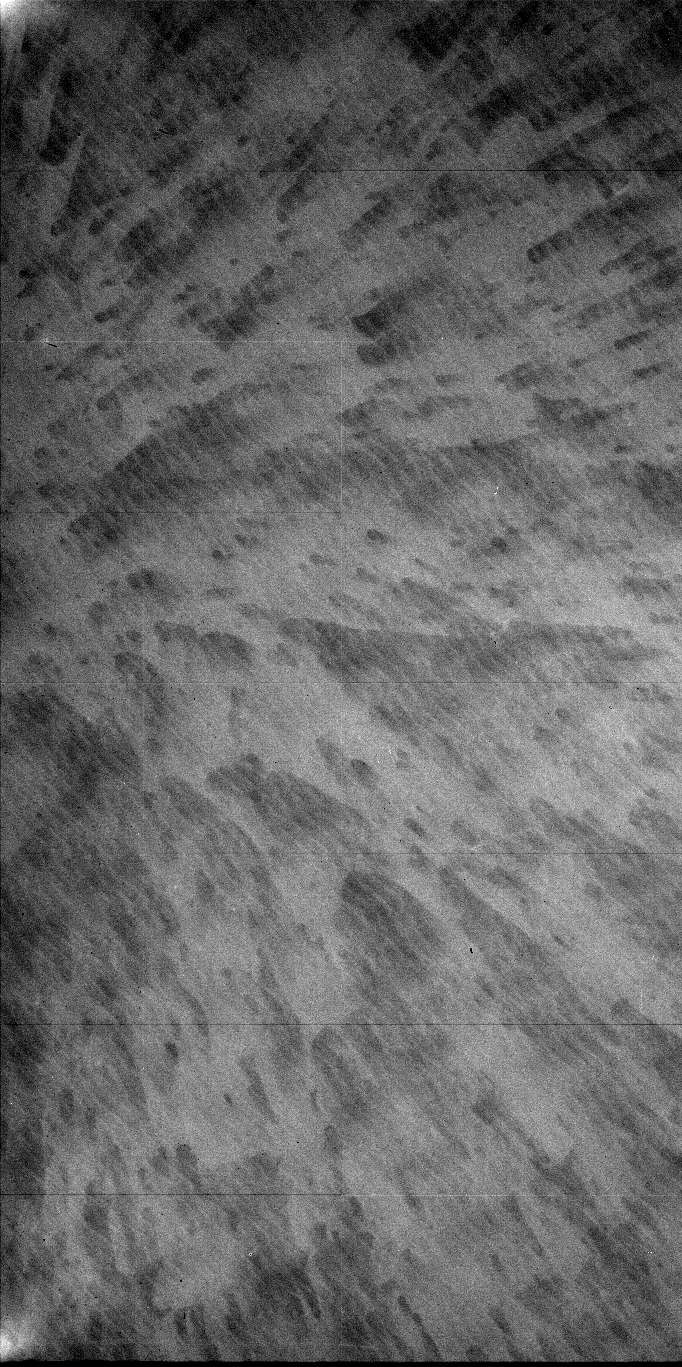
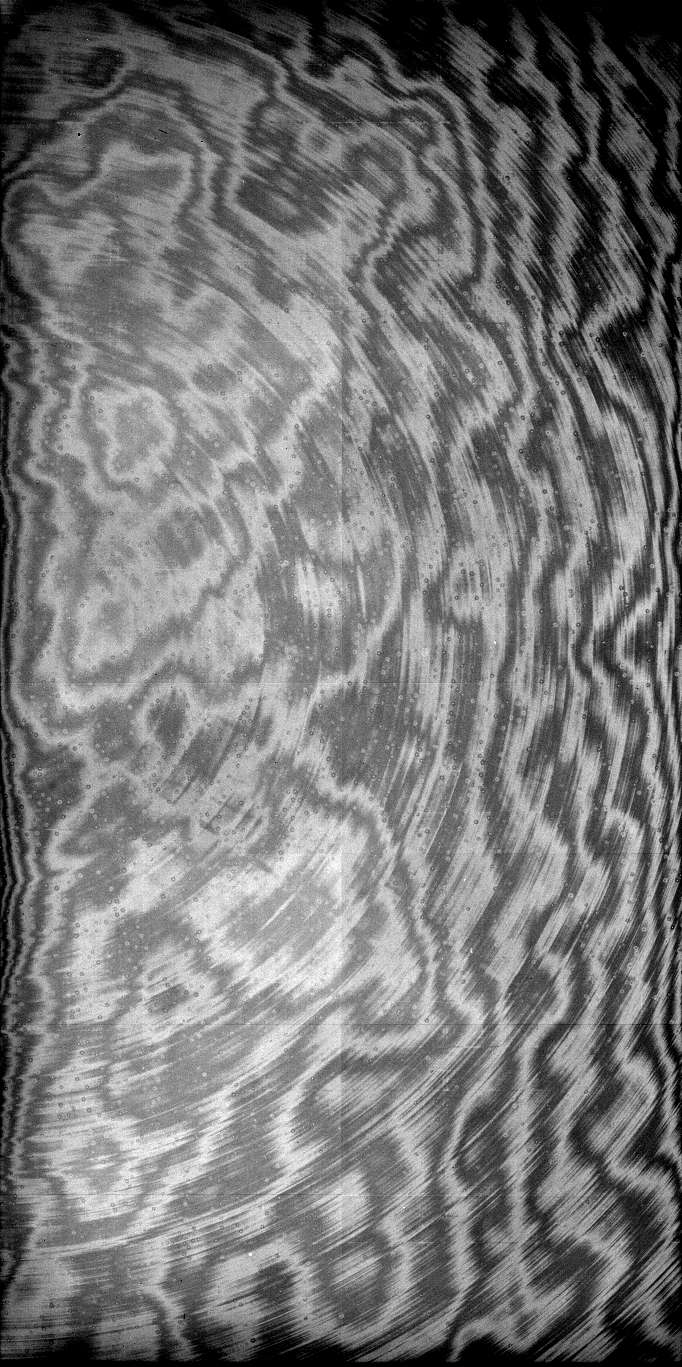
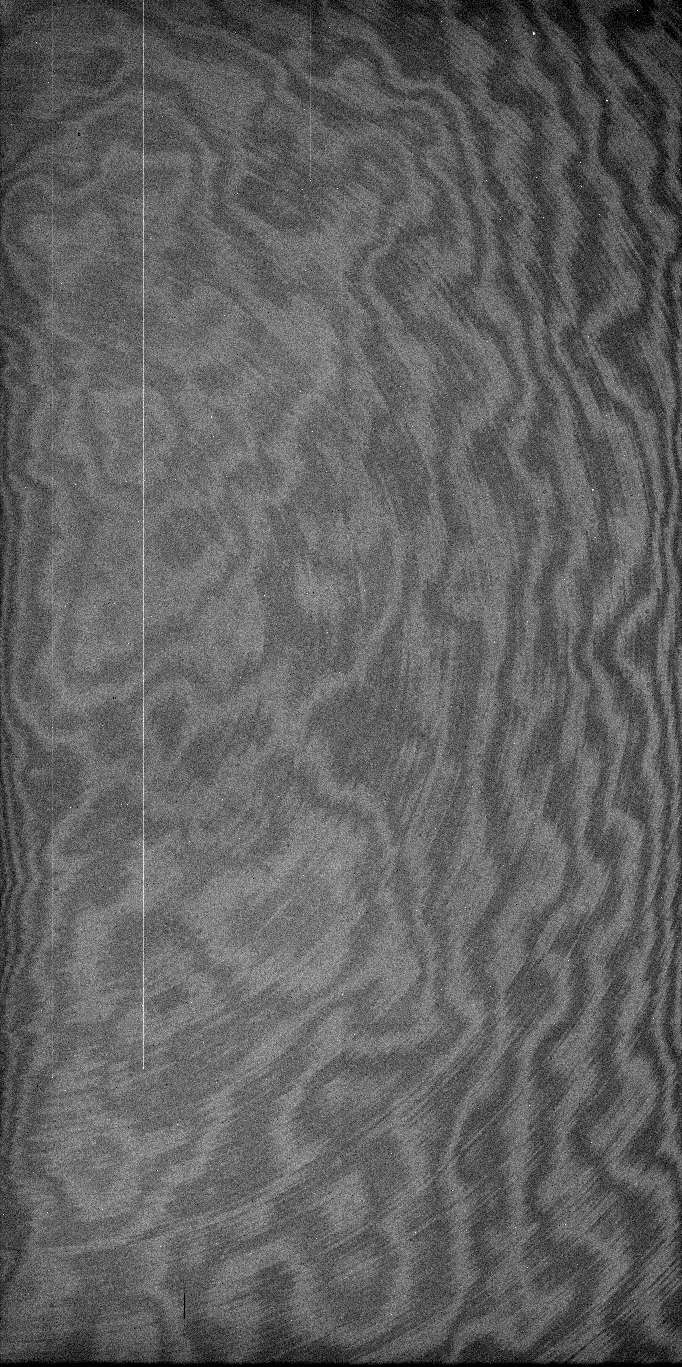
For the flat field we use three wavelengths, 350nm, 600nm and 900nm. For each wavelength we make two images, high level (45000 ADU) and low level (1000 ADU).
350nm (UV), bandwidth 5nm |
600nm, bandwidth 5nm |
900nm, bandwidth 5nm |
|||
|
|
|
|
|
|
|
High level |
Low level |
High level |
Low level |
High level |
Low level |
Table 6: Flat field for three wavelengths.
Remark: Strange pattern at 350nm.
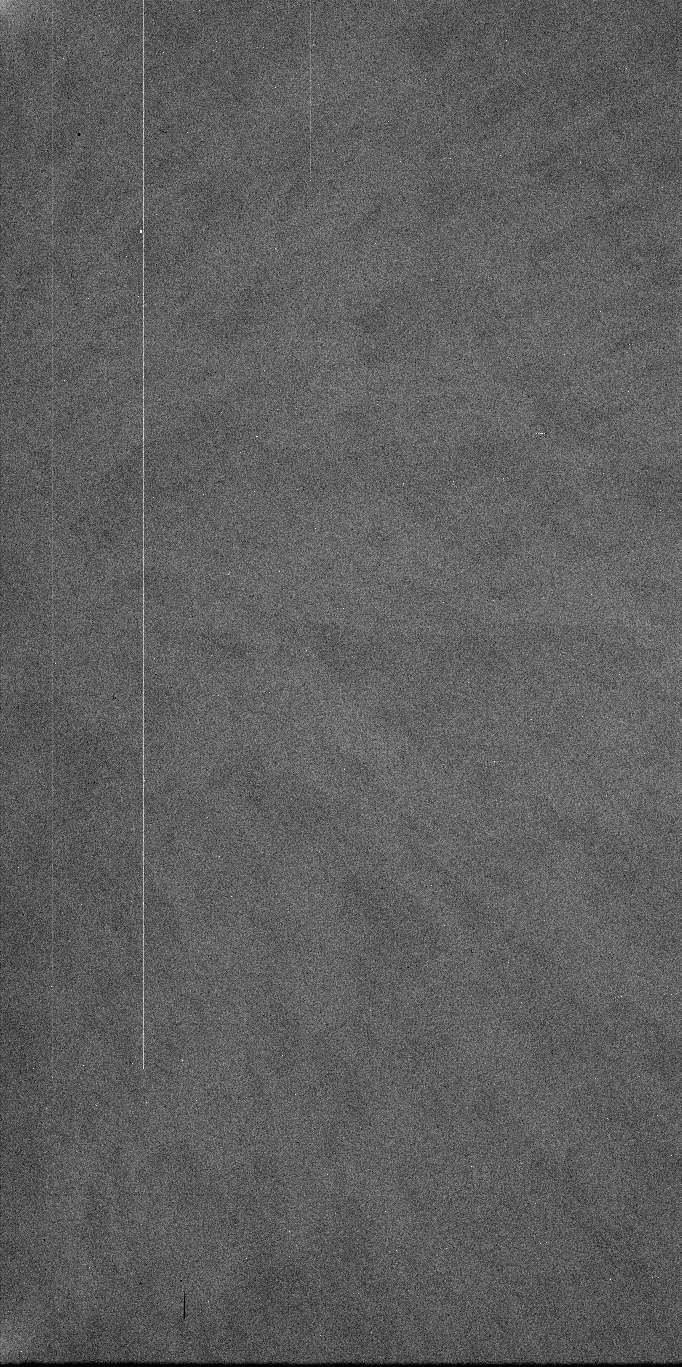
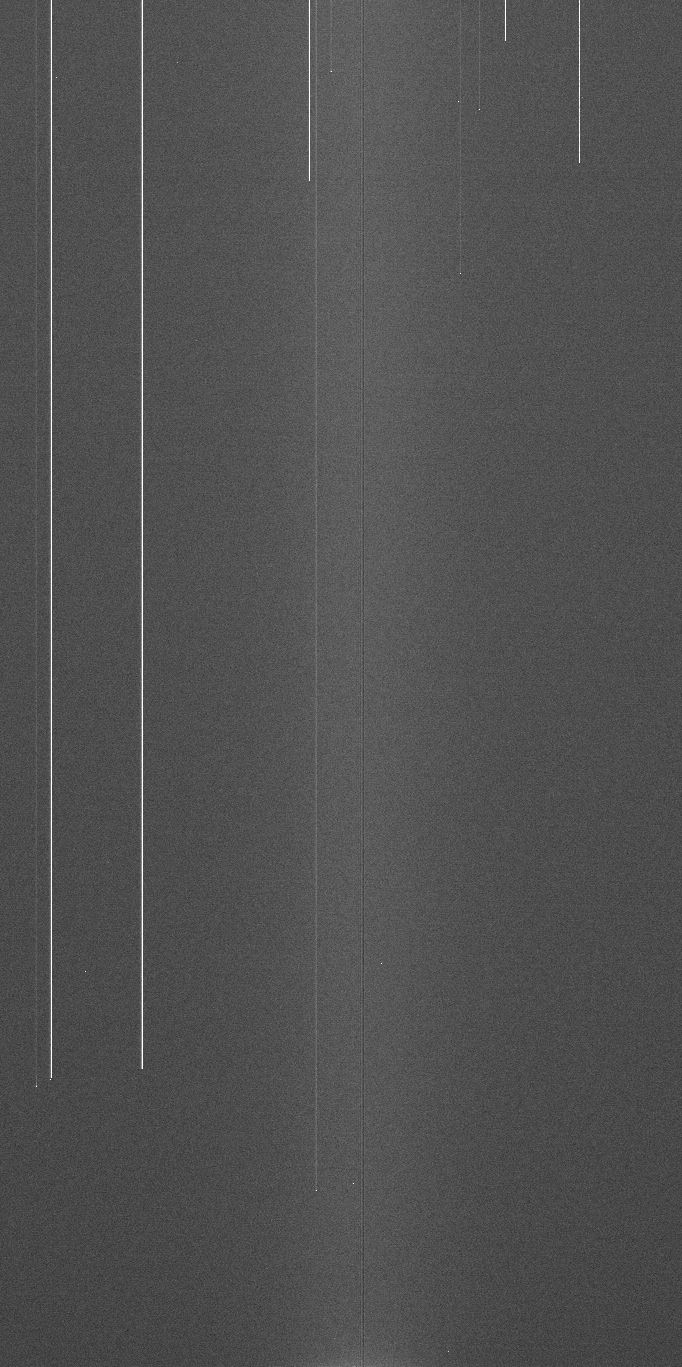
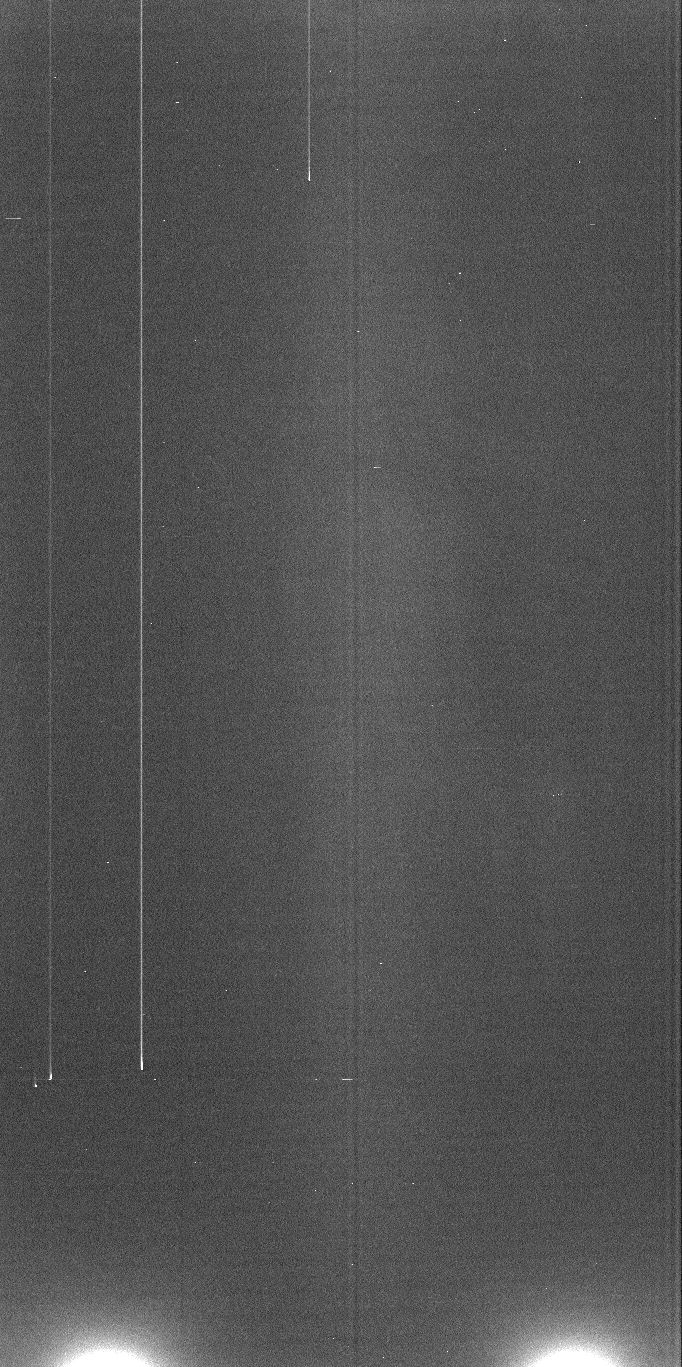
The time exposure, for the long dark exposure, is 3600 seconds.
|
Bias |
Long exposure dark image |
|---|---|
|
|
|
Table 7: Bias and dark.
Remark: As you can see on the dark image we have on this CCD some electroluminescence (two white spots below).
Clock mode: 225kpx/rlrl/HG/512

Left readout port
Conversion Factor=   0.60093e-/ADU ±0.002338     for 20402.2ADU
RMS noise        =   3.9704e-      ±0.212

Right readout port
Conversion Factor=   0.59636e-/ADU ±0.003876     for 20694.1ADU
RMS noise        =   7.0509e-      ±0.5928

Clock mode: 50kpx/rlrl/HG/512

Left readout port
Conversion Factor=   0.58016e-/ADU ±0.0022       for 20439.4ADU
RMS noise        =   2.6985e-      ±0.1145

Right readout port
Conversion Factor=   0.57271e-/ADU ±0.001877     for 20805.5ADU
RMS noise        =   3.1529e-      ±0.1362
RMS non linearity (%)         = 1.1
Peak to peak non linearity (%)= 3.3

Figure 12: Error of linearity
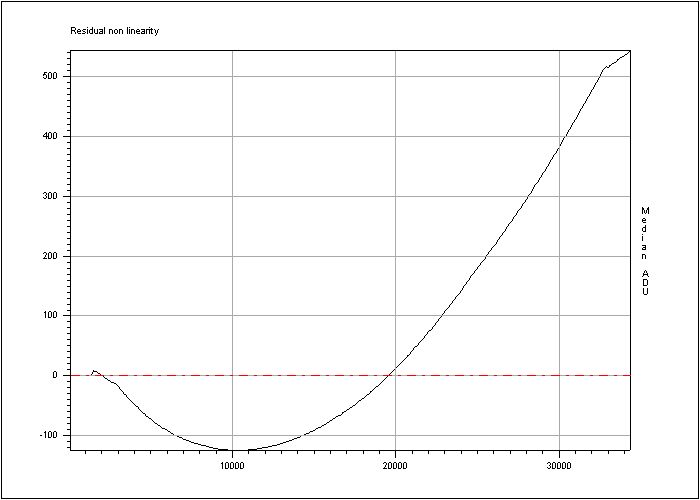
Figure 13: Residual non linearity.
Exposure time (s) = 3600
Dark current : 2.95 ± 0.03 ADU/hour/pixel
Dark current : 1.63 ± 0.02 e-/hour/pixel
High level (Around 25000 ADU)
Horizontal CTE = 0.999998
Vertical CTE   = 0.9999991
In this section we expose the hot pixel, the dark pixel, the trap and the very large trap we found.
A hot pixel provides a signal of > 60 e- / pixel / hour.
Result: 114 hot points.
a very bright pixel provides a signal of > 200000 e-/pixel/hour
A dark pixel is one with 50% or less than the average output for uniform intensity light level, measured with a flat field level around 500 photo-electrons.
Result: 331 dark pixels detected.
A trap is defined as a pixel that captures more than 10 electrons, measured with a flat field level around 500 photo-electrons.
Result: 16 trap
A very large trap is defined as a pixel that captures more than 10 000 electrons, measured with a flat field level around 90% of full well capability.
Result: / very large trap.
A bad column is 10 or more contiguous hot or dark pixels in a single column or a very bright pixel or a very large trap.
Result: 1 bad columns.
Here is a summary of cosmetic defects:
|
|
Hot pixel |
Dark pixel |
A very bright pixel (a) |
Trap |
Very large trap (b) |
Sup. 10 contiguous pixels (c) |
Total bad column (a+b+c) |
|---|---|---|---|---|---|---|---|
|
ESO |
114 |
331 |
/ |
16 |
/ |
1 |
1 |
|
Marconi |
417 |
6 |
3 |
1 |
0 |
7 |
|
Table 8: Summary of cosmetic defects.
Be careful, in the ESO test report we didn't include the very large trap in the total bad column because for this CCD we couldn't measure this parameter.
Back to the overview page ESO Test Reports for the OmegaCAM CCDs