Centaurus: ESO CCD Test Report
EEV 44-82 -1-A57
CCD name : Centaurus
Serial number
: 9253-12-02
Type : Backside, Single layer AR Pixel size 15x15 µm
Number of photosensitive pixels 2048 x 4102 [HxV]
Number of
outputs : 2
Overall rating :
Test date :
Clock mode: EEV 1p/225k/HG 512
Facteur de convertion0.55743e-/ADU ±0.001413 pour 19221.5ADU
Bruit RMS= 4.3414e- ±0.2035
CCD temperature : -127.5Cº
Window area is : X1= 54 X2= 2096 Y1= 1 Y2= 510
Bandwidth 5nm
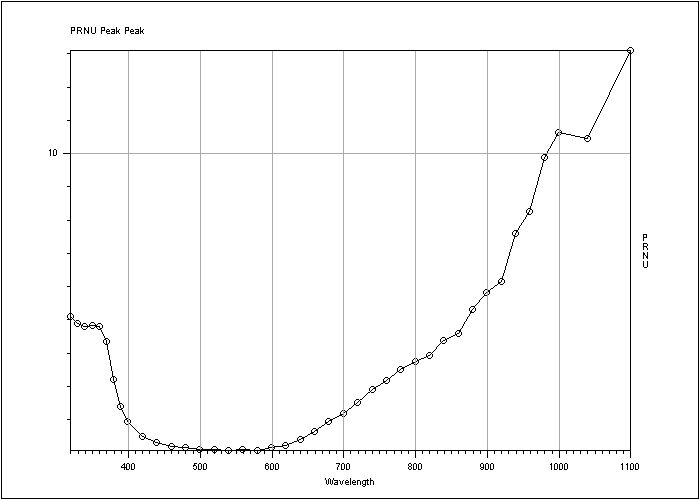
Long. QE% PRNU rms% Phase=
320 51.8 ±1.5 5.08 7.022918
330 57.1 ±1.6 4.89 6.983739
340 60.3 ±1.2 4.79 6.960706
350 61.4 ±0.6 4.82 6.96772
360 63.6 ±0.63 4.8 6.966903
370 67.6 ±0.67 4.33 6.866038
380 74.2 ±0.73 3.18 6.563983
390 80.4 ±0.83 2.38 6.275785
400 82.8 ±0.84 1.93 6.068561
420 84.7 ±0.85 1.48 5.800091
440 85.7 ±0.86 1.29 5.656704
460 84.7 ±0.85 1.19 5.5687
480 83.3 ±0.84 1.15 5.533916
500 83.1 ±0.83 1.09 5.475505
520 82.4 ±0.83 1.09 5.483837
540 81.1 ±0.82 1.06 5.455268
560 79.6 ±0.8 1.08 5.478313
580 79 ±0.79 1.07 5.471101
600 77.6 ±0.77 1.16 5.556521
620 76.6 ±0.75 1.22 5.615405
640 75 ±0.73 1.4 5.75091
660 72.8 ±0.71 1.64 5.909241
680 70.2 ±0.67 1.92 6.050243
700 67 ±0.63 2.18 6.171075
720 64.6 ±0.59 2.5 6.270137
740 61.6 ±0.56 2.89 6.391506
760 58 ±0.52 3.16 6.470081
780 54.4 ±0.48 3.51 6.555355
800 49.9 ±0.43 3.74 6.624481
820 45.4 ±0.39 3.91 6.642589
840 40.6 ±0.34 4.36 6.75658
860 35.4 ±0.3 4.57 6.819146
880 30.1 ±0.24 5.3 6.952618
900 25.2 ±0.2 5.82 7.084044
920 19.7 ±0.15 6.14 7.183002
940 15.1 ±0.12 7.57 7.38505
960 11.1 ±0.085 8.26 7.491048
980 7.43 ±0.056 9.86 7.653822
1000 4.38 ±0.033 10.6 7.73565
1040 0.766 ±0.0057 10.4 7.764373
1100 0.0864 ±0.00064 13.1 7.994556
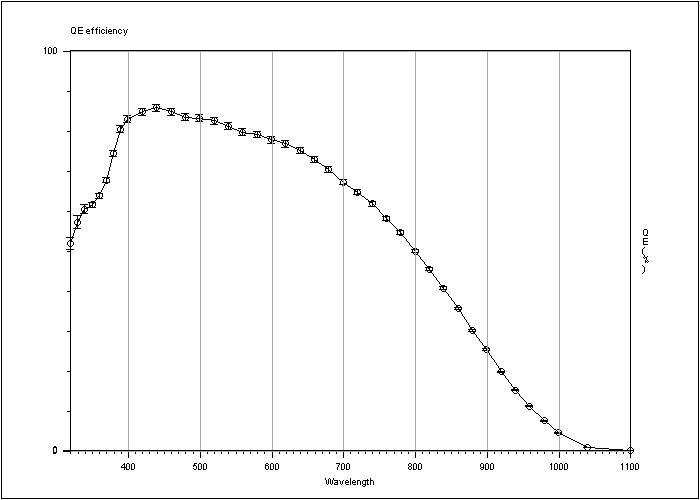
Table 1: Measurement of the Quantum Efficiency.
Figure 1: Graphic representation of the QE.
Figure 2: Graphic representation of the PRNU.
In this section you can compare the QE we measured with the testbench and
QE Minimum specification
Typical QE
QE from Marconi
Figure 3: Comparison between the QE measured by ESO, the QE measured by Marconi,
ESO specification and minimum specification.
|
Comparison QE ESO / QE Marconi |
||||
|
Wavelength (nm) |
QE ESO (%) |
QE Marconi (%) |
Difference (Eso - Marc. %) |
Relative difference (Marconi as reference %) |
|
350 |
61.4 |
57.7 |
3.7 |
6.4 |
|
400 |
82.8 |
82.6 |
0.2 |
0.2 |
|
500 |
83.1 |
81.4 |
1.7 |
2.1 |
|
650 |
73.9 |
73 |
0.8 |
1.1 |
|
900 |
25.2 |
25.6 |
-0.4 |
-1.6 |
Table 2: Difference and relative difference between ESO measurement and Marconi.
Figure 4: Graphic representation of the difference and the relative difference.
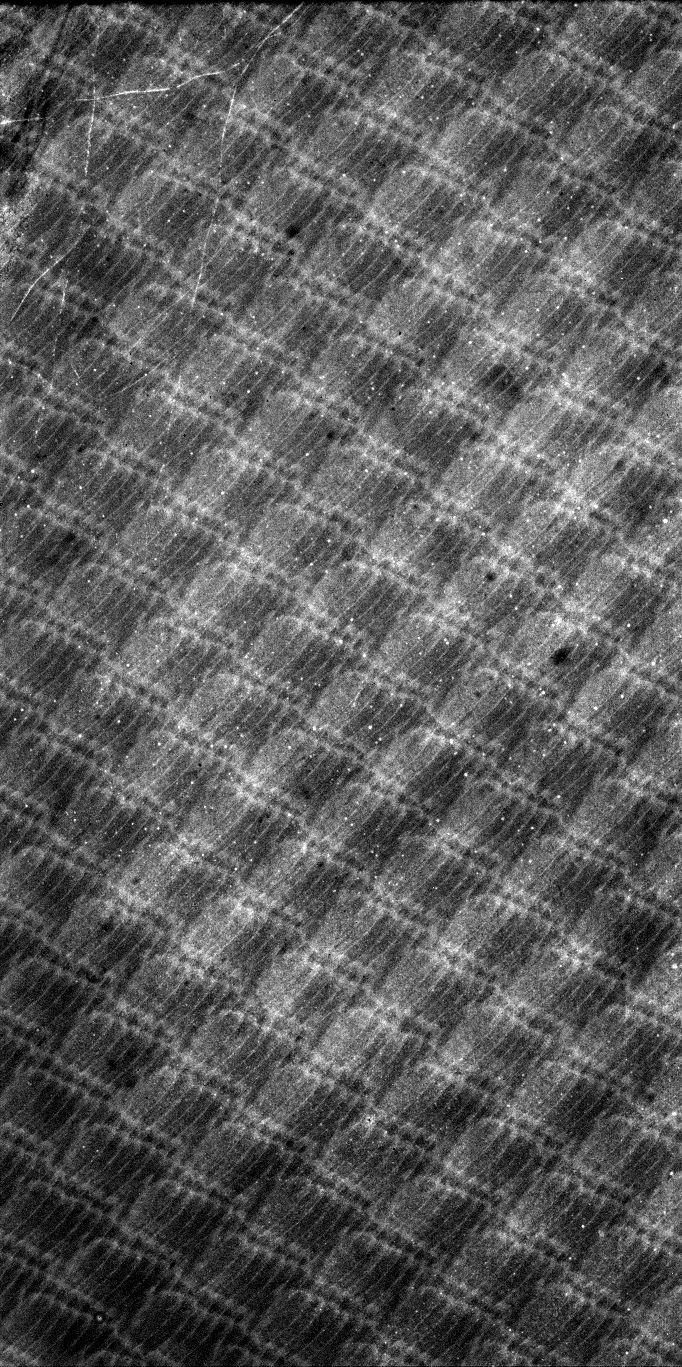
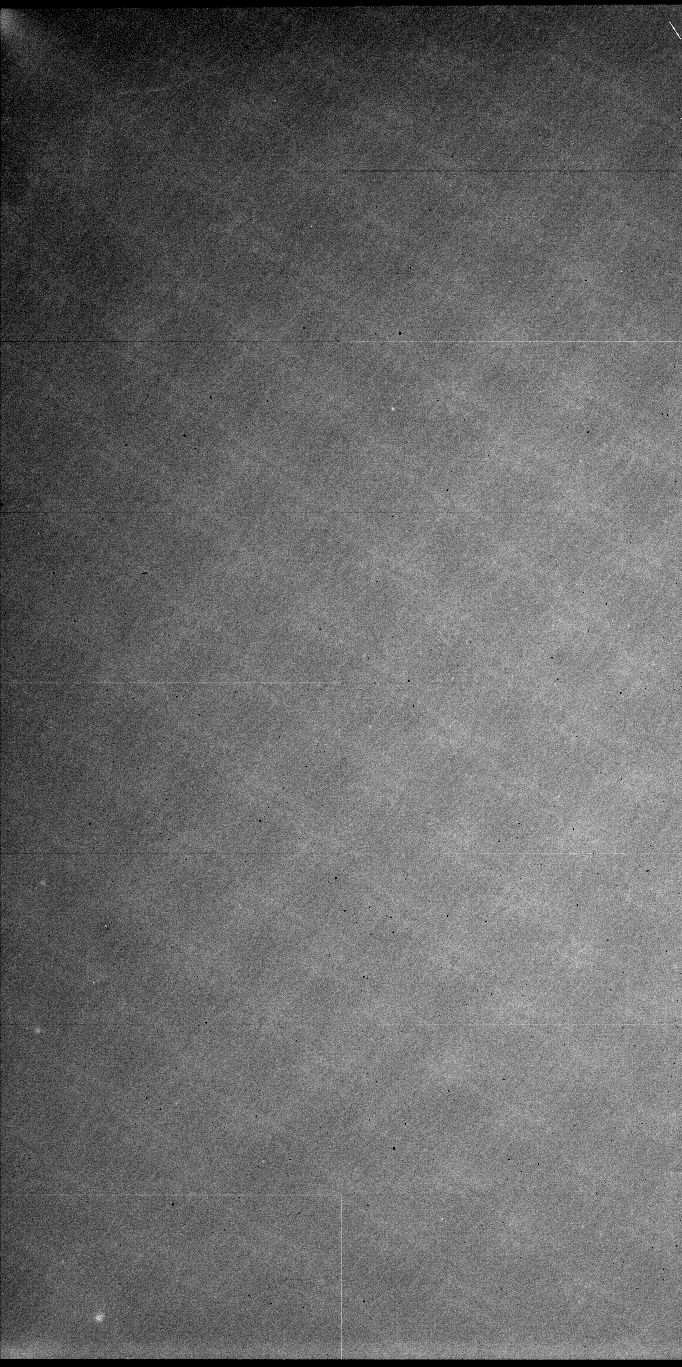
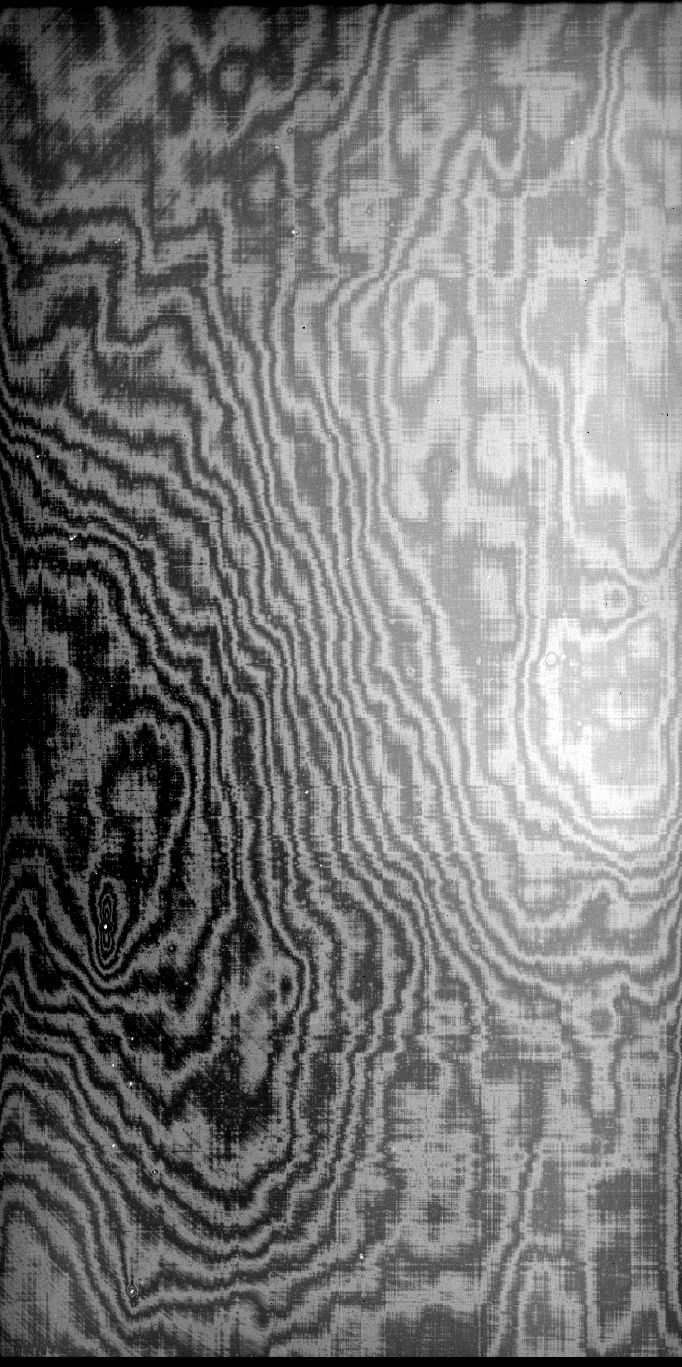
For the flat field we use three wavelengths, 350nm, 600nm and 900nm. For each wavelength we make two images, high level (45000 ADU) and low level (1000 ADU).
350nm (UV), bandwidth 5nm |
600nm, bandwidth 5nm |
900nm, bandwidth 5nm |
|||
|
|
|
|
|
|
|
High level |
Low level |
High level |
Low level |
High level |
Low level |
Table 3: Flat field for three wavelengths.
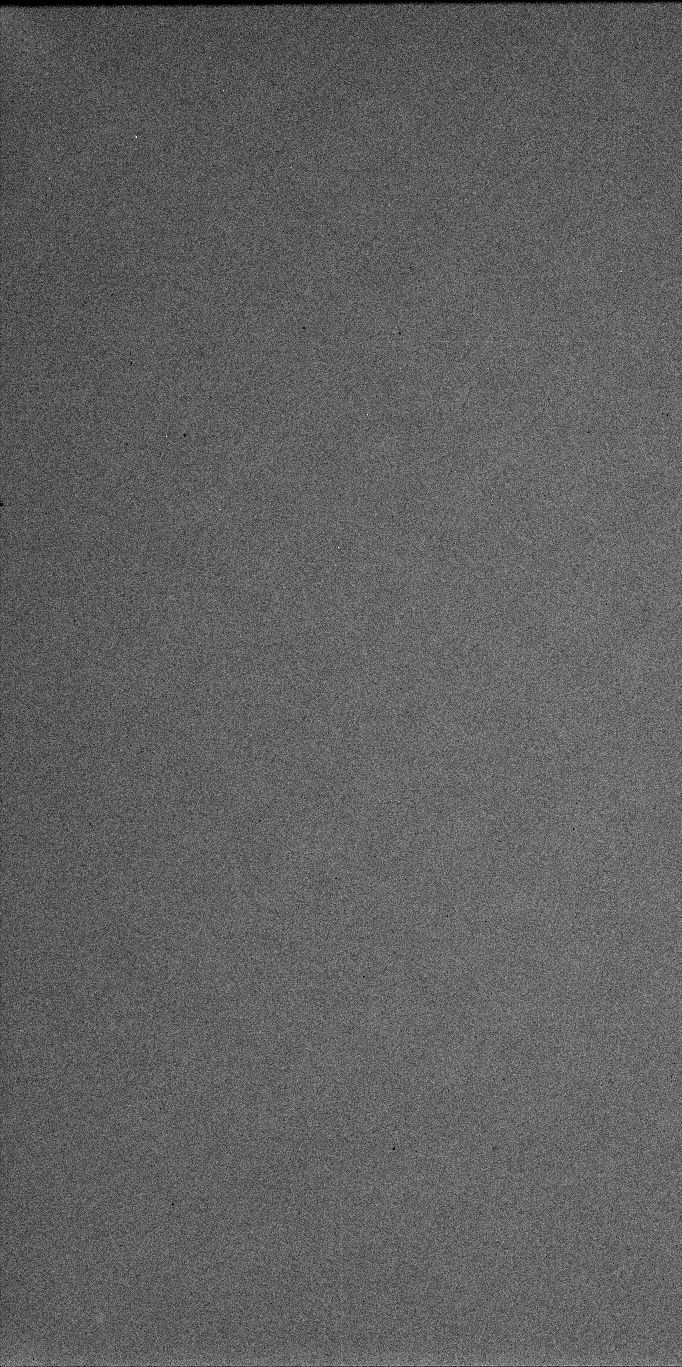
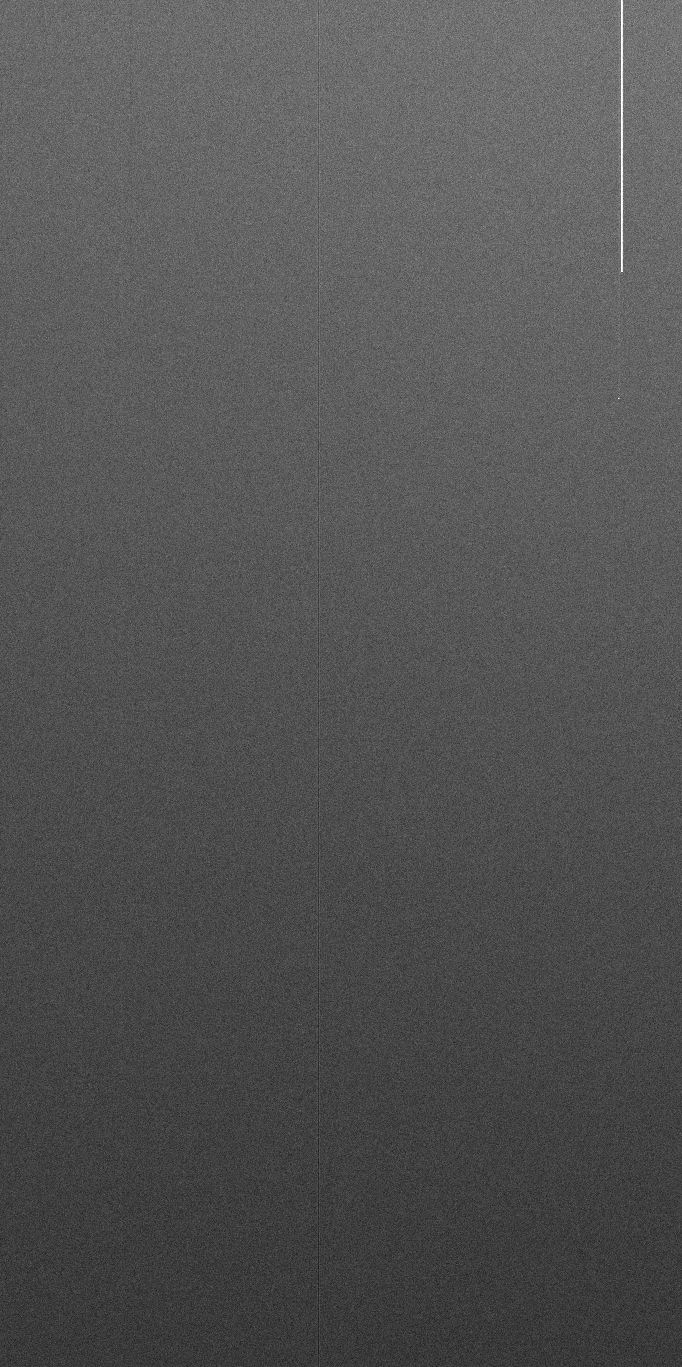
The time exposure, for the long dark exposure, is 3600 seconds.
|
Bias |
Long exposure dark image |
|---|---|
|
|
|
Table 4: Bias and dark.
Clock mode: EEV 1p/225k/HG 512
Conversion Factor=   0.55996e-/ADU ±0.006228     for 26138.7ADU
RMS noise        =   5.0088e-      ±0.7387

Clock mode: EEV 1p/50k/HG 512 Right port
Conversion factor= 0.53674e-/ADU ±0.001465     for 26266.6ADU
RMS noise=           2.8367e-      ±0.1701

Clock mode: 50kpx/4p/HG/512 Left port
Conversion factor= 0.66114e-/ADU ±0.002947     for 23286.8ADU
RMS noise=           3.4024e-      ±0.3855
RMS non linearity (%)         =    0.310187
Peak to peak non linearity (%)=    0.965229
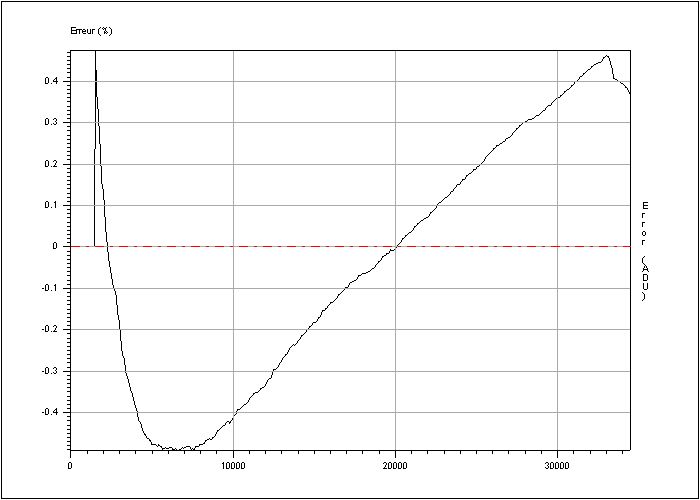
Figure 5: Error of linearity.
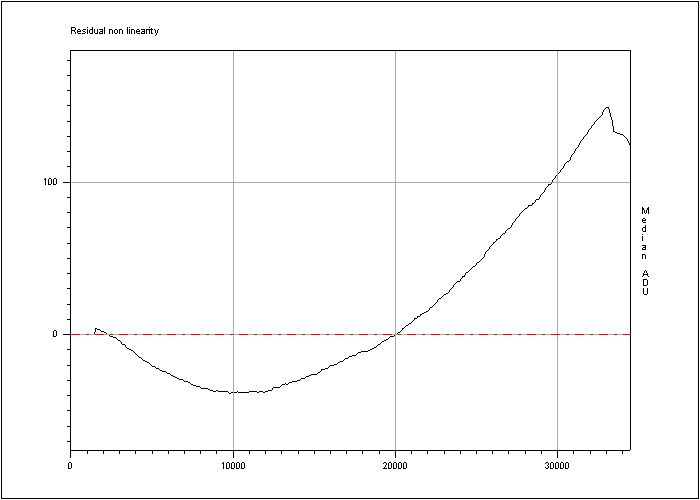
Figure 6: Residual non linearity.
Exposure time (s) = 3600
Dark current : 1.8e-/hour/pixel
Horizontal CTE = 1
Vertical CTE = 0.9999995
In this section we expose the hot pixel, the dark pixel, the trap and the very large trap we found.
A hot pixel provides a signal of > 60 e- / pixel / hour.
Result: 74 hot points.
|
Position |
|||
X=339; Y=3516 X=370; Y=1340 X=780; Y=174 X=780; Y=175 X=780; Y=176 X=780; Y=177 X=784; Y=1651 X=790; Y=3791 X=819; Y=2630 X=822; Y=2630 X=823; Y=2630 X=825; Y=3614 X=1031; Y=2677 X=1250; Y=525 X=1520; Y=4089 X=1522; Y=3780 X=1522; Y=3783 X=1523; Y=3644 X=1541; Y=3630 |
X=1542; Y=3433 X=1545; Y=2944 X=1547; Y=2671 X=1557; Y=3779 X=1559; Y=3461 X=1570; Y=1628 X=1571; Y=4094 X=1572; Y=3869 X=1572; Y=3881 X=1573; Y=3689 X=1573; Y=3781 X=1574; Y=3909 X=1582; Y=2208 X=1601; Y=3689 X=1612; Y=3401 X=1633; Y=3547 X=1656; Y=3899 X=1677; Y=3668 X=1696; Y=3461 |
X=1721; Y=3364 X=1724; Y=3381 X=1753; Y=3334 X=1756; Y=3277 X=1815; Y=3724 X=1836; Y=3030 X=1849; Y=3334 X=1860; Y=2580 X=1861; Y=2907 X=1861; Y=2906 X=1861; Y=2908 X=1863; Y=2907 X=1863; Y=3631 X=1872; Y=3283 X=1872; Y=3284 X=1872; Y=3285 X=1872; Y=3286 X=1872; Y=3287 X=1872; Y=3288 |
X=1872; Y=3289 X=1872; Y=3290 X=1872; Y=3291 X=1875; Y=2076 X=1879; Y=3461 X=1879; Y=3462 X=1900; Y=3289 X=1915; Y=3338 X=1950; Y=3334 X=1984; Y=3106 X=1985; Y=3469 X=1985; Y=3475 X=2004; Y=3462 X=2011; Y=3924 X=2030; Y=1505 X=2031; Y=1498 X=2031; Y=1505 |
Total hot pixel: 74 |
|||
Table 5: Position and images of the hot pixels.
A dark pixel is one with 50% or less than the average output for uniform intensity light level, measured with a flat field level around 500 photo-electrons.
Result: dark pixels detected.
|
Position |
|||
X= 3; Y= 2590 X= 26; Y= 153 X= 39; Y= 3798 X= 83; Y= 2180 X= 148; Y= 1874 X= 225; Y= 2238 X= 225; Y= 2239 X= 225; Y= 2240 X= 271; Y= 1629 X= 380; Y= 2767 X= 381; Y= 2767 X= 392; Y= 3010 X= 392; Y= 3011 X= 392; Y= 3012 X= 392; Y= 3039 |
X= 392; Y= 3040 X= 393; Y= 3038 X= 396; Y= 3009 X= 396; Y= 3010 X= 396; Y= 3011 X= 396; Y= 3012 X= 396; Y= 3013 X= 415; Y= 1797 X= 440; Y= 2971 X= 483; Y= 774 X= 492; Y= 1890 X= 599; Y= 1957 X= 639; Y= 734 X= 780; Y= 1639 X= 781; Y= 1639 |
X= 813; Y= 1538 X= 911; Y= 3118 X= 912; Y= 3117 X= 912; Y= 3118 X= 912; Y= 3119 X= 913; Y= 3117 X= 913; Y= 3118 X= 913; Y= 3119 X= 914; Y= 3118 X= 1008; Y= 1467 X= 1009; Y= 1466 X= 1009; Y= 1467 X= 1022; Y= 1802 X= 1092; Y= 197 X= 1092; Y= 1171 |
X= 1092; Y= 1172 X= 1093; Y= 197 X= 1093; Y= 198 X= 1093; Y= 1171 X= 1094; Y= 197 X= 1103; Y= 880 X= 1217; Y= 1463 X= 1343; Y= 1354 X= 1758; Y= 3260 X= 1765; Y= 2805 X= 1823; Y= 4100 X= 2003; Y= 2857 |
Total hot pixel: 57 |
|||
Table 6: Position and images of the dark pixels.
A trap is defined as a pixel that captures more than 10 electrons, measured with a flat field level around 500 photo-electrons.
Result: Not available
A very large trap is defined as a pixel that captures more than 10 000 electrons, measured with a flat field level around 90% of full well capability.
Result: Not available.
A bad column is 10 or more contiguous hot or dark pixels in a single column or a very bright pixel or a very large trap.
Result: 2 bad columns.
|
Position |
Image |
|
X= 1870; Y= 3283 |
|
|
X= 1216; Y= 524 |
|
|
Table 7: Position and images of the bad columns. The values in the table are in ADU. Conversion factor: 1.1 e-/ADU
Here is a summary of cosmetic defects:
|
|
Hot pixel |
Dark pixel |
A very bright pixel (a) |
Trap |
Very large trap (b) |
Sup. 10 contiguous pixels (c) |
Total bad column (a+b+c) |
|---|---|---|---|---|---|---|---|
|
ESO |
74 |
57 |
/ |
/ |
/ |
2 |
2 |
|
Marconi |
53 |
2 |
6 |
0 |
0 |
2 |
|
Table 8: Summary of cosmetic defects.
Be careful, in the ESO test report we didn't include the very large trap in the total bad column because for this CCD we couldn't measure this parameter.
Back to the overview page ESO Test Reports for the OmegaCAM CCDs