[Top] [Prev] [Next] [Bottom]
12.2 Observation-Level POSITION Errors
An individual observation in POSITION mode acquires a single target in FineLock and tracks it for a specifed period of time. The goal of the observation is to pinpoint the target's location in FGS detector space. Pipeline processing of POSITION mode data (see "POSITION Mode Pipeline" on page 11-3) converts the Star Selector A,B encoder angles into detector space (x,y) coordinates for the three FGSs and computes the median of these values over the period of time when the object was being tracked in FineLock by the astrometer. It then adjusts the astrometer's (x,y) centroid using data gathered by the four photomultiplier tubes (PMTs) during the slew of the IFOV to the target (to measure the background and dark counts), the WalkDown to FineLock, and the FineLock tracking of the object. This adjusted centroid is subsequently corrected for optical field angle distortion (OFAD), the aberration of the aspheric mirror, the cross filter effect if applicable (see page 12-9), and finally, differential velocity aberration. Here we address the errors remaining after these steps.
12.2.1 Rotation Angle Errors
The FGE reads rotation angles of the Star Selector A and B assemblies as 21-bit integers. The 14 most significant bits are determined by optically reading an absolute binary code pattern, while the 7 least significant bits are derived from an optical resolving device that reads a special encoder disk pattern that generates a quadrature set of sinusoidal signals. A correction to the 7 least significant bits leaves an uncertainty in the (x,y) values estimated to be about +/- 0.3 mas owing to noise and non-repeatability of the optical reader. The corrections to the 14 most significant bits are absorbed in the optical field angle distortion (see below) and therefore do not contribute here.
12.2.2 Centroiding Errors
During nominal FineLock tracking of an object, the instantaneous field of view of the FGS will jitter and drift about the (x,y) median over time scales not shorter than the fine error signal averaging time (FESTIME) and as long as the low frequency vibrational modes of the spacecraft (up to 40 seconds). The standard deviation of these excursions depends upon the magnitude of the target and HST vehicular jitter.
Target Magnitude
Because the FGS tracks an object by computing and implementing corrections to the current position of the IFOV on the basis of the fine error signal, noise in the PMT counts can introduce errors in the corrections. To compensate for the increase of the photometric noise for fainter targets, the FESTIME is increased to boost the signal/noise of the fine error signal. This adjustment not only yields fewer independent samples of the target's position but also results in more sluggish tracking. For example, a 320s exposure of a 17th magnitude object having an FESTIME = 3.2s generates only about 100 independent measurements of the target's position, while an observation of the same duration of a 9th magnitude object with FESTIME = 0.025s yields 12800 independent samples. In addition, as the FESTIME increases, the rms excursions of the IFOV about the interferometric null tend to be larger because the FGS responds more slowly to the high frequency HST vibrational modes (faster than 0.1 Hz). Figure 12.1 plots the standard deviation about the x and y centroids of 5000 stars measured in FineLock as a function of the target's magnitude. Note how steeply the standard deviation rises past V > 12.
Figure 12.1: Standard Deviation of IFOV about Median (x,y) Position as Function of Target Magnitude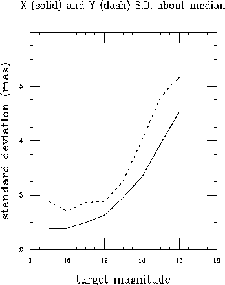
The standard deviation of the FineLock tracking is not a direct measure of the observation's accuracy-it is the repeatability of the centroiding that reflects the observation's reliability. The pipeline computes the centroids over segments of the exposure, and it is the dispersion of these values that should be used to assess accuracy. Generally, the repeatability is about 1 mas for V < 14.5, increasing to about 2 mas for V = 16.
Vehicular Jitter
Analysis of both the guide star and astrometry data can reveal how successfully HST's pointing control system guided the spacecraft and stabilized its attitude during an observation. The guiding FGSs track their guide stars in FineLock, so their centroids and standard deviations can be computed and compared to those from the astrometer for identical intervals of time. The centroids of all three FGSs will show some jitter owing to the magnitude effect discussed above. However, the pointing control system is designed to minimize the impact of the internal jitter in the guiding FGSs on the pointing of the spacecraft, and for the most part, it succeeds. The jitter of bright astrometry targets is not systematically higher than that of the guide stars.
Nevertheless, transient events during the course of an observation can jitter the telescope, introducing additional noise in the tracking of the guide stars and the astrometry target. For example, as HST moves from orbital day to night or night to day, its solar panels undergo large temperature changes that excite HST's vibrational modes. These vibrations increase the standard deviations of FineLock tracking in the three FGSs by up to a factor of eight over the pre-transition values. Some events actually cause a small (5 mas) but significant temporary repointing of the telescope.
Figure 12.2 shows how night-to-day transitions can affect HST's pointing. The excited vibrational modes of HST are readily apparent and contrast sharply with the quiescence of normal guiding seen prior to the transition. This extreme case clearly demonstrates how such terminator crossings can induce significant spacecraft jitter.
Figure 12.2: Guide Star Motion in FGS 2 Before and During Night-to-Day -Transition 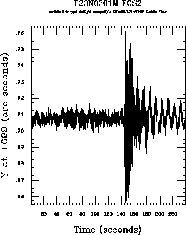
Spacecraft jitter had been a major problem for astrometry observations during the first three years of the mission. The FGSs could not reliably hold the guide stars in FineLock over the span of the visit, and once lost, the guide stars for astrometry observations would not be recovered for the remainder of the orbit. However, improvements to both the pointing control system, in January 1993, and the solar panels, replaced in the first servicing mission, have reduced spacecraft jitter to a mild nuisance in the astrometry data reduction process which is well handled by proper application of the guide star data.
12.2.3 Locating Interferometric Null
The discussion of the acquisition of an object in FineLock (page 9-18) pointed out that the FGE attempts to eliminate differences in the responses of the two PMTs on a given channel by computing their average difference (DIFF) and average sum (SUM) at the starting point of the WalkDown to FineLock. For the remainder of the WalkDown and tracking in FineLock, the fine error signal is computed making use of these values, as described on page 9-18.
The quality of this correction to the fine error signal depends in part on the errors in the determinations of DIFF and SUM, which depend in turn on the target magnitude and the integration time used to compute them. For bright stars (V < 12.5) the FESTIME is 25 msec and the DIFF, SUM values are computed from 16 25msec intervals (0.4 sec). On the other hand, the FESTIME for a 13th magnitude star is 50 msec, but the DIFF, SUM integration time remains at 0.4 sec, so only 8 FESTIME intervals are represented. Table 12.1 shows the FESTIME and DIFF, SUM integration times as a function of target magnitude. The important point to note is that as target magnitude increases, fewer FESTIME integrations are included in the evaluation of the DIFF and SUM. The values in this table are representative; actual FESTIME values depend on the filter and mode in use.
As targets become fainter, the FGE applies increasingly unreliable DIFF and SUM values in its calculation of the fine error signal and therefore risks locking onto a region of the S-curve which is not the true interferometric null. Figure 9.12 shows an example of the segment of an S-curve sampled during a WalkDown to FineLock. In this case, the FGS's estimate of the fine error signal's value at null is not quite correct. Pipeline processing can determine the true null more accurately by using the WalkDown data to calculate better values of DIFF and SUM. The following values go into the adjustment of the median (x,y) centroid of the astrometer for this effect:
12.2.4 Optical Field Angle Distortion
Optical field angle distortion (OFAD) alters the measured relative angular separations of stars distributed across the FGS's pickle from their true angular separations. This distortion originates from both the FGS/OTA optical train and errors in the 14 most significant bits of the 21-bit Star Selector A and B encoder values. Correcting for this distortion is absolutely necessary for all POSITION mode observing programs that visit the target field at a variety of HST orientations (roll angles). The Space Telescope Astrometry Science Team has made extensive efforts to calibrate optical field angle distortion and to maintain this calibration.
This correction is independent of target magnitude, color, or exposure time, and depends only upon the location of the object within an FGS's detector space. Residuals from the calibration itself indicate how well it accounts for this uncertainty in POSITION mode observations. In an OFAD calibration, the FGS observes a field of stars at several different HST pointings and roll angles. Measured changes in the angular separations of these stars as a function of the telescope's orientation on the sky must be a signature of the instrument itself.
Because no ground-based astrometric catalog of adequate accuracy exists for calibrating the FGS, the OFAD calibration program must simultaneously and self-consistently generate a 2 mas star catalog while deriving the distortion correction. Comparisons of this star catalog, taken to represent the true positions of the stars, with the individual FGS observations, corrected according to the derived distortion model, reveal the accuracy of the correction itself in terms of the residuals that remain. This procedure is analogous to the simpler case of fitting a line to a distribution of points and computing the standard deviation of the points along the line to determine the quality of the fit. In this case, the star catalog corresponds to the line, while the corrected star positions correspond to the points. Because of boundary effects and the distribution of the stars in the pickle that were observed in the calibration proposal, the smallest residuals occur in the central region of the pickle, with larger residuals near the edges or extreme azimuthal ends. In the area where most astrometry science observations are made, residuals are typically slightly more than 1 mas per axis, suggesting that the uncertainty of a given measurement is about 1.5 mas. Toward the pickle edges and azimuthal extremes, the errors can become as large as 3 to 4 mas. Figure 12.3 shows a plot of the residuals from the OFAD calibration as a function of position in the pickle of FGS 3. The residuals shown can be attributed both to small errors in the catalog and to errors in the OFAD calibration.
Figure 12.3: Comparison of Observed Star Positions (Corrected for OFAD) with Cataloged Star Positions (Derived from OFAD Calibration) 
12.2.5 Lateral Color Error
The chromatic response of the five element corrector group, the polarizing beam splitter, the filter, and the Koester prisms, introduces a slight color dependence into the tilt of a wave front measured by the FGS. This chromatic effect results in both a displacement of the target's position in the FGS's field of view and stretching of its S-curve. The effect on the S-curve is important for TRANSFER mode observing and will be discussed in "Resolving Structure with TRANSFER Mode" on page 13-5. The displacements of greater concern are POSITION mode observations. If left uncorrected, these will result in an apparent HST roll-dependent motion of the star with respect to the background reference stars of different color.
Two on-orbit attempts to calibrate this lateral color effect directly have been made. These tests were largely unsuccessful, owing to the poor distribution of reference stars, strong reliance on the OFAD corrections, and small sizes of the lateral color shifts. Ground based tests were conducted prior to installing FGS 3 on HST, but because these did not use a spherically aberrated beam, and because launch and gravity release significantly affected FGS 3's internal alignments, those measurements are not considered to be reliable and therefore are not used in the calibration.
As stated above, the lateral color effect will masquerade as roll-dependent motion of an object if it has a color temperature significantly different from that of the reference field. The size and sign of this effect as a function of color difference are not well understood. It is suspected to be important only when the color differences exceed one magnitude, where it is estimated to be about 1 mas.
12.2.6 Cross Filter Effect
The cross filter calibration addresses the apparent change in the measured position of an object observed in POSITION mode as function of the filter selected for the observation. As with the lateral color effect, any shift, if unaccounted for, will result in an apparent HST roll-dependent motion of the object relative to those stars measured through a different filter.
The FGS filter wheel can be rotated to bring any one of five different filters into the optical path. Of these filters, generally only the F583W and F5ND are used in POSITION mode astrometry. The other, full-aperture filters, F550W and F605W have not been used because their spectral band passes offer no observing advantage over the wide bandpass F583W. The F5ND is actually an attenuator of approximately five magnitudes rather than a filter, and it is used when the target is too bright to be observed with the F583W filter.
Occupying the 5th slot on the wheel is the PUPIL. It is not a filter but rather a 2/3 pupil stop. Use of the pupil significantly reduces the degrading effect of spherical aberration but collaterally alters the field dependence of the distortions. Consequently, the OFAD calibration for the F583W filter cannot be applied to PUPIL observations. And because there are no OFAD calibrations for the PUPIL, it is not supported in POSITION mode for science observations.
Because POSITION mode astrometry uses only the F583W and F5ND filters, only these two need be compared for the cross filter calibration. The calibration program itself was a three orbit test which measured the position of a bright (V = 8.08) star at three locations in the pickle. The position of the star was measured in each orbit by alternate observations using the F583W and the F5ND, for a total of 12 pairs (24 observations). The shifts were found to be different at each of the three locations, indicating a field dependent response. The shifts were also larger than expected, up to 7 mas in x and y, but the formal errors of the test were small, at about 1 mas.
Because of the field dependency of the cross filter calibration and the paucity of locations (three) within the pickle where it has been measured, it is risky to apply these large corrections to data collected at any other position in the pickle. Nearly all science observations that require this correction use the F5ND filter at pickle center, a location supported by the calibrations. In such fortunate cases, the uncertainty of the measurement is about 1 mas.
12.2.7 Differential Velocity Aberration
Differential velocity aberration modifies the apparent angle between the optical axis of the telescope and a point on the celestial sphere by an amount depending on the component of the spacecraft's velocity vector along the line of sight. During the course of an observing session the angle between the HST's velocity vector and its optical axis changes as the spacecraft orbits the Earth, thereby changing the apparent angle between the optical axis and a given point on the celestial sphere. It is possible to repoint the telescope continuously to maintain the angle between its optical axis and a single, chosen position on the celestial sphere, or equivalently, to keep the light from a patch of sky at given RA and Dec focused at a chosen alignment point in HST's focal plane. However, it is impossible to do so across the entire field of view of an FGS. Therefore, the measured position of an object within an FGS must be corrected for differential velocity aberration.
The factors that contribute to the overall error of this correction include uncertainties in the relative positions of the three FGSs, and hence the precise V2,V3 coordinates of the astrometry targets, plus uncertainties in the guide-star coordinates and the location of the alignment point. Other contributing factors include errors in HST's orbital ephemeris and the Earth's heliocentric ephemeris. Inspection of one-minute integrations of the (V2,V3) coordinates of the dominant guide star, corrected for this aberration, over the course of the visit provide a good assessment of the overall residuals to be expected from the differential velocity aberration correction. While these corrections can be as large as 30 mas (under suitable geometric conditions) the corrected dominant guide star positions repeat at sub-millisecond of arc. Therefore, the correction for differential velocity aberration is estimated to be uncertain at about +/- 0.3 mas.
12.2.8 Lever Arm Length and Offset Angle
Early in the HST mission it became clear that FGS 3 was undergoing a scale change over time. Such changes were not unexpected because several of the optical elements in the instrument are mounted on graphite-epoxy composite surfaces known to absorb water vapor at atmospheric pressure and to outgas once in orbit, changing the alignments within the instrument and the effective scale of the detector space. Monitoring of the standard astrometric field M35 has helped to track these changes, leading to time-dependence of Star Selector A's lever arm length and offset angle. These corrections are referred to as the RhoA and KA corrections.
Although there is little physical basis for the success of this approach, the result is the preservation of the internal relative scale and a minimization of temporally evolving gradients to the OFAD calibration. The uncertainties which remain after this correction are estimated from the residuals of plate comparisons of the individual visits in the calibration program. Over the entire field of view of FGS 3, the rms residuals are typically 2 mas along the x-axis, 3 mas along the y-axis. Much better performance is achieved in the central region of the pickle, 1mas on each axis.
[Top] [Prev] [Next] [Bottom]
stevens@stsci.edu
Copyright © 1997, Association of Universities for Research in Astronomy. All rights
reserved.
Last updated: 11/13/97 16:55:09