Plot
? |
Symb
? |
Source
* |
Average ? |
Thresholds ? |
N_
data |
QC1
parameter |
Data
downloads |
Remarks |
| method |
value |
unit |
method |
value |
| 1 |
• | QC1DB |
MEDIAN |
0.117 |
NONE |
none | |
15 |
abseff_max |
this |
last_yr |
all
|
absolute efficiency, UT1 |
| 2 |
• | QC1DB |
MEDIAN |
0.125 |
NONE |
none | |
11 |
abseff_max |
this |
last_yr |
all
|
absolute efficiency, UT2 |
| 3 |
• | QC1DB |
MEDIAN |
0.121 |
NONE |
none | |
9 |
abseff_max |
this |
last_yr |
all
|
absolute efficiency, UT3 |
| 4 |
• | QC1DB |
MEDIAN |
0.114 |
NONE |
none | |
7 |
abseff_max |
this |
last_yr |
all
|
absolute efficiency, UT4 |
| |
|
*Data sources: QC1DB: QC1 database; LOCAL: local data source
|
Plot 1
scores: not implemented
| | data source: | espresso_std
(QC1 database) |
| dataset: | abseff_max | • |
| median: | 0.117 | NONE |
| thresholds: | none | |
| N_data plotted: | 15 |
| [click plot for closeup] |
Plot 2
scores: not implemented
| | data source: | espresso_std
(QC1 database) |
| dataset: | abseff_max | • |
| median: | 0.125 | NONE |
| thresholds: | none | |
| N_data plotted: | 11 |
| [click plot for closeup] |
Plot 3
scores: not implemented
| | data source: | espresso_std
(QC1 database) |
| dataset: | abseff_max | • |
| median: | 0.121 | NONE |
| thresholds: | none | |
| N_data plotted: | 9 |
| [click plot for closeup] |
Plot 4
scores: not implemented
| | data source: | espresso_std
(QC1 database) |
| dataset: | abseff_max | • |
| median: | 0.114 | NONE |
| thresholds: | none | |
| N_data plotted: | 7 |
| [click plot for closeup] |
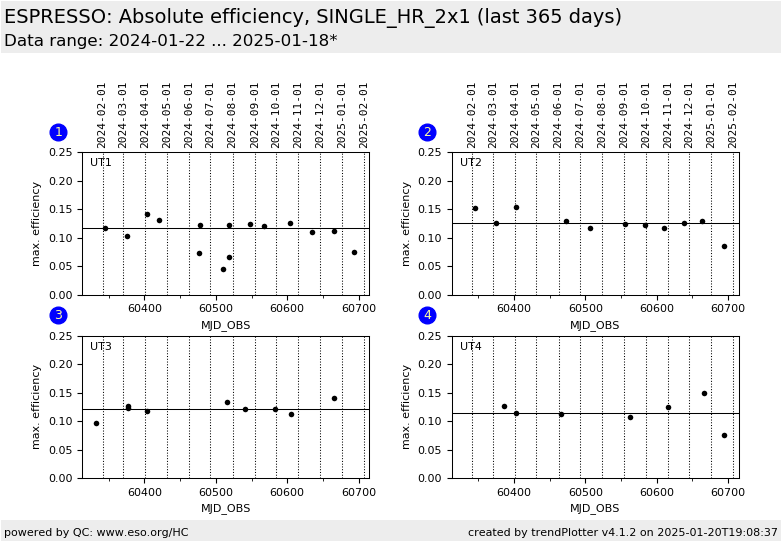
Trending plots for absolute efficiency as derived from standard star observations.
Two kinds of plots exist. The first set shows trending versus time of the absolute efficiency
that is corrected for extinction and for losses due to the fibre size. These values should not
depend on seeing. The second set of plots shows efficiency versus seeing; here the efficiency
is only corrected for extinction and not for losses due to the fibre diameter.
Only measurements after 2018-09-01 are included in the plots.
General information
Click on any of the plots to see a close-up version.
The latest date is indicated on top of the plot.
If configured,
- data points belonging to the latest date are specially marked
- statistical averages are indicated by a solid line, and thresholds by broken lines
- outliers are marked by a red asterisk. They are defined as data points outside the
threshold lines
- "aliens" (= data points outside the plot Y limits) are marked by a red arrow (↑ or ↓)
- you can download the data for each parameter set if the 'Data downloads' link shows up
|
