Plot
? |
Symb
? |
Source
* |
Average ? |
Thresholds ? |
N_
data |
QC1
parameter |
Data
downloads |
Remarks |
| method |
value |
unit |
method |
value |
| 1 |
• | QC1DB |
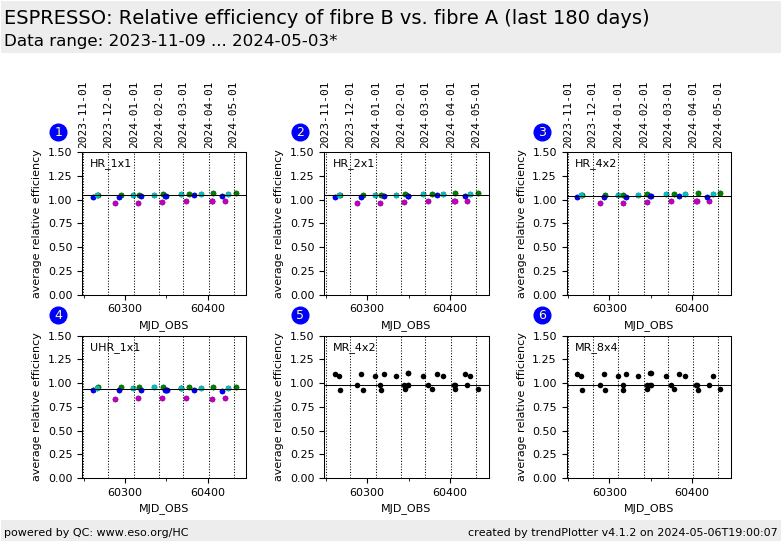
MEDIAN |
1.04 |
NONE |
none | |
20 |
releff_avg |
this |
last_yr |
all
|
relative efficiency fibre B vs. A, SINGLEHR, 1x1 binning, any UT |
| 1 |
• | QC1DB |
none |
|
NONE |
none | |
6 |
releff_avg |
this |
last_yr |
all
|
relative efficiency fibre B vs. A, SINGLEHR, 1x1 binning, UT1 (FEU1) |
| 1 |
• | QC1DB |
none |
|
NONE |
none | |
6 |
releff_avg |
this |
last_yr |
all
|
relative efficiency fibre B vs. A, SINGLEHR, 1x1 binning, UT2 (FEU2) |
| 1 |
• | QC1DB |
none |
|
NONE |
none | |
4 |
releff_avg |
this |
last_yr |
all
|
relative efficiency fibre B vs. A, SINGLEHR, 1x1 binning, UT3 (FEU3) |
| 1 |
• | QC1DB |
none |
|
NONE |
none | |
4 |
releff_avg |
this |
last_yr |
all
|
relative efficiency fibre B vs. A, SINGLEHR, 1x1 binning, UT4 (FEU4) |
| 2 |
• | QC1DB |
MEDIAN |
1.04 |
NONE |
none | |
19 |
releff_avg |
this |
last_yr |
all
|
relative efficiency fibre B vs. A, SINGLEHR, 2x1 binning, any UT |
| 2 |
• | QC1DB |
none |
|
NONE |
none | |
5 |
releff_avg |
this |
last_yr |
all
|
relative efficiency fibre B vs. A, SINGLEHR, 2x1 binning, UT1 (FEU1) |
| 2 |
• | QC1DB |
none |
|
NONE |
none | |
6 |
releff_avg |
this |
last_yr |
all
|
relative efficiency fibre B vs. A, SINGLEHR, 2x1 binning, UT2 (FEU2) |
| 2 |
• | QC1DB |
none |
|
NONE |
none | |
4 |
releff_avg |
this |
last_yr |
all
|
relative efficiency fibre B vs. A, SINGLEHR, 2x1 binning, UT3 (FEU3) |
| 2 |
• | QC1DB |
none |
|
NONE |
none | |
4 |
releff_avg |
this |
last_yr |
all
|
relative efficiency fibre B vs. A, SINGLEHR, 2x1 binning, UT4 (FEU4) |
| 3 |
• | QC1DB |
MEDIAN |
1.04 |
NONE |
none | |
19 |
releff_avg |
this |
last_yr |
all
|
relative efficiency fibre B vs. A, SINGLEHR, 4x2 binning, any UT |
| 3 |
• | QC1DB |
none |
|
NONE |
none | |
5 |
releff_avg |
this |
last_yr |
all
|
relative efficiency fibre B vs. A, SINGLEHR, 4x2 binning, UT1 (FEU1) |
| 3 |
• | QC1DB |
none |
|
NONE |
none | |
6 |
releff_avg |
this |
last_yr |
all
|
relative efficiency fibre B vs. A, SINGLEHR, 4x2 binning, UT2 (FEU2) |
| 3 |
• | QC1DB |
none |
|
NONE |
none | |
4 |
releff_avg |
this |
last_yr |
all
|
relative efficiency fibre B vs. A, SINGLEHR, 4x2 binning, UT3 (FEU3) |
| 3 |
• | QC1DB |
none |
|
NONE |
none | |
4 |
releff_avg |
this |
last_yr |
all
|
relative efficiency fibre B vs. A, SINGLEHR, 4x2 binning, UT4 (FEU4) |
| 4 |
• | QC1DB |
MEDIAN |
0.94 |
NONE |
none | |
19 |
releff_avg |
this |
last_yr |
all
|
relative efficiency fibre B vs. A, SINGLEUHR, 1x1 binning, any UT |
| 4 |
• | QC1DB |
none |
|
NONE |
none | |
5 |
releff_avg |
this |
last_yr |
all
|
relative efficiency fibre B vs. A, SINGLEUHR, 1x1 binning, UT1 (FEU1) |
| 4 |
• | QC1DB |
none |
|
NONE |
none | |
6 |
releff_avg |
this |
last_yr |
all
|
relative efficiency fibre B vs. A, SINGLEUHR, 1x1 binning, UT2 (FEU2) |
| 4 |
• | QC1DB |
none |
|
NONE |
none | |
4 |
releff_avg |
this |
last_yr |
all
|
relative efficiency fibre B vs. A, SINGLEUHR, 1x1 binning, UT3 (FEU3) |
| 4 |
• | QC1DB |
none |
|
NONE |
none | |
4 |
releff_avg |
this |
last_yr |
all
|
relative efficiency fibre B vs. A, SINGLEUHR, 1x1 binning, UT4 (FEU4) |
| 5 |
• | QC1DB |
MEDIAN |
0.982 |
NONE |
none | |
19 |
releff_avg |
this |
last_yr |
all
|
relative efficiency fibre B vs. A, MULTIMR, 4x2 binning |
| 6 |
• | QC1DB |
MEDIAN |
0.982 |
NONE |
none | |
19 |
releff_avg |
this |
last_yr |
all
|
relative efficiency fibre B vs. A, MULTIMR, 8x4 binning |
| |
|
*Data sources: QC1DB: QC1 database; LOCAL: local data source
|
Plot 1
scores: not implemented
| | data source: | espresso_skyflat
(QC1 database) |
dataset:
(numbers below apply to this dataset) | releff_avg | • |
| median: | 1.04 | NONE |
| thresholds: | none | |
| N_data plotted: | 20 |
| [click plot for closeup] |
Plot 2
scores: not implemented
| | data source: | espresso_skyflat
(QC1 database) |
dataset:
(numbers below apply to this dataset) | releff_avg | • |
| median: | 1.04 | NONE |
| thresholds: | none | |
| N_data plotted: | 19 |
| [click plot for closeup] |
Plot 3
scores: not implemented
| | data source: | espresso_skyflat
(QC1 database) |
dataset:
(numbers below apply to this dataset) | releff_avg | • |
| median: | 1.04 | NONE |
| thresholds: | none | |
| N_data plotted: | 19 |
| [click plot for closeup] |
Plot 4
scores: not implemented
| | data source: | espresso_skyflat
(QC1 database) |
dataset:
(numbers below apply to this dataset) | releff_avg | • |
| median: | 0.94 | NONE |
| thresholds: | none | |
| N_data plotted: | 19 |
| [click plot for closeup] |
Plot 5
scores: not implemented
| | data source: | espresso_skyflat
(QC1 database) |
| dataset: | releff_avg | • |
| median: | 0.982 | NONE |
| thresholds: | none | |
| N_data plotted: | 19 |
| [click plot for closeup] |
Plot 6
scores: not implemented
| | data source: | espresso_skyflat
(QC1 database) |
| dataset: | releff_avg | • |
| median: | 0.982 | NONE |
| thresholds: | none | |
| N_data plotted: | 19 |
| [click plot for closeup] |
Trending plot for relative efficiency of fibre B compared to fibre A as derived from sky flats.
Only measurements with an average signal-to-noise ratio larger than 50 are
plotted.
General information
Click on any of the plots to see a close-up version.
The latest date is indicated on top of the plot.
If configured,
- data points belonging to the latest date are specially marked
- statistical averages are indicated by a solid line, and thresholds by broken lines
- outliers are marked by a red asterisk. They are defined as data points outside the
threshold lines
- "aliens" (= data points outside the plot Y limits) are marked by a red arrow (↑ or ↓)
- you can download the data for each parameter set if the 'Data downloads' link shows up
|
