Plot
? |
Symb
? |
Source
* |
OPS?
** |
Average ? |
Thresholds ? |
N_
data |
QC1
parameter |
Data
downloads |
Remarks |
| method |
value |
unit |
method |
value |
| 1 |
• | QC1DB |
yes (0) |
MEDIAN |
58 |
ADU |
VAL | 10,60 |
5 |
flux |
this |
last_yr |
all
|
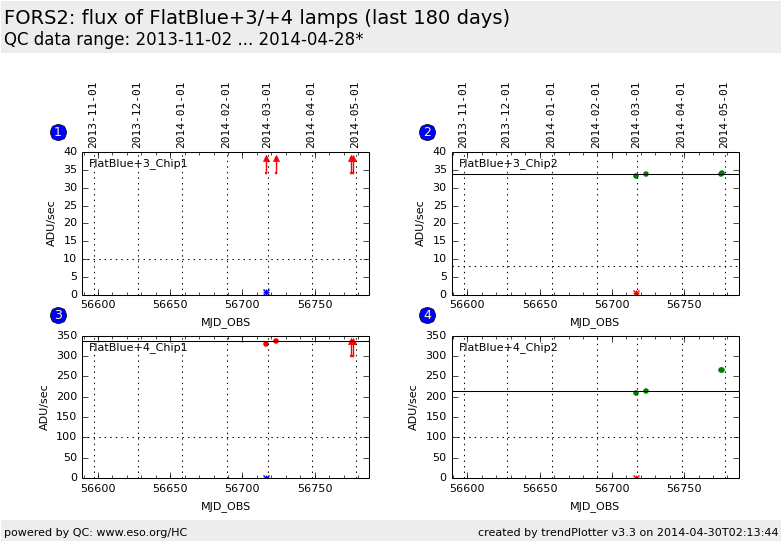
normalized flux of FlatBlue+3 lamp for chip 1 |
| 2 |
• | QC1DB |
yes (0) |
MEDIAN |
33.8 |
ADU |
VAL | 8,50 |
5 |
flux |
this |
last_yr |
all
|
normalized flux of FlatBlue+3 lamp for chip 2 |
| 3 |
• | QC1DB |
yes (0) |
MEDIAN |
337 |
ADU |
VAL | 100,370 |
5 |
flux |
this |
last_yr |
all
|
normalized flux of FlatBlue+4 lamp for chip 1 |
| 4 |
• | QC1DB |
yes (0) |
MEDIAN |
214 |
ADU |
VAL | 100,370 |
5 |
flux |
this |
last_yr |
all
|
normalized flux of FlatBlue+4 lamp for chip 2 |
| |
|
*Data sources: QC1DB: QC1 database; LOCAL: local text file | **OPS: OPSLOG data are included
|
Plot 1
scores: [an error occurred while processing this directive] | | data source: | fors2_lamp_chk
(QC1 database) |
| dataset: | flux | • |
| median: | 58 | ADU |
| fixed thresholds: | 10...60 | ADU |
| N_data plotted: | 5 |
| [click on plot for closeup] |
Plot 2
scores: [an error occurred while processing this directive] | | data source: | fors2_lamp_chk
(QC1 database) |
| dataset: | flux | • |
| median: | 33.8 | ADU |
| fixed thresholds: | 8...50 | ADU |
| N_data plotted: | 5 |
| [click on plot for closeup] |
Plot 3
scores: [an error occurred while processing this directive] | | data source: | fors2_lamp_chk
(QC1 database) |
| dataset: | flux | • |
| median: | 337 | ADU |
| fixed thresholds: | 100...370 | ADU |
| N_data plotted: | 5 |
| [click on plot for closeup] |
Plot 4
scores: [an error occurred while processing this directive] | | data source: | fors2_lamp_chk
(QC1 database) |
| dataset: | flux | • |
| median: | 214 | ADU |
| fixed thresholds: | 100...370 | ADU |
| N_data plotted: | 5 |
| [click on plot for closeup] |
This parameter is determined from an overscan-subtracted calibration
lamp exposure in LSS mode (taken with the template
FORS2_lss_tec_flatLampcheck). The total signal is integrated and
normalized by the exposure time and the total number of original CCD
pixels (keeping into account possible binning). More information can
be found in the plot
tutorial.
The setup of the lamp check is G300V, GG435 and 1arcsec slit.
- FFB12
Monitoring the lamp flux of the two
blue low brightness halogen lamps FlatBlue+1 and FlatBlue+2.
These lamps are used to generate imaging screen flats.
- FFB34
Monitoring the lamp flux of the two
high brightness blue halogen lamps FlatBlue+3 and FlatBlue+4.
These lamps are used to generate spectroscopic flats in blue (G300V, G600B) spectroscopic setups.
- FFR34
Monitoring the lamp flux of the two
red halogen lamps FlatRed+3 and FlatRed+4.
These lamps are used to generate spectroscopic flats in red spectroscopic setups.
DB Name: fors2_lamp_chk
TPL.ID: FORS2_lss_tec_flatLampcheck
QC1 DB parameter: flux
General information
Click on any of the plots to see a close-up version.
If applicable, the latest values from Paranal ops logs are plotted as blue dots. More information about those values, including a download option, is available in the OPS column.
The latest date is indicated on top of the plot, data points belonging to that date are specially marked.
If configured,
- statistical averages are indicated by a solid line, and thresholds by broken lines
- outliers are marked by a red asterisk. They are defined as data points outside the
threshold lines
- "aliens" (= data points outside the plot Y limits) are marked by a red arrow (↑ or ↓)
- you can download the data for each parameter set if the 'Data downloads' link shows up
|
