Plot
? |
Symb
? |
Source
* |
Average ? |
Thresholds ? |
N_
data |
QC1
parameter |
Data
downloads |
Remarks |
| method |
value |
unit |
method |
value |
| 1 |
• | QC1DB |
MEDIAN |
3.78e+03 |
e/s |
VAL | 1000,4000 |
36 |
fluxavg_sc1 |
this |
last_yr |
all
|
SC flat-field flux from input 1, HIGH resolution, SPLIT polarisation |
| 2 |
• | QC1DB |
MEDIAN |
3.74e+03 |
e/s |
VAL | 1000,4000 |
36 |
fluxavg_sc2 |
this |
last_yr |
all
|
SC flat-field flux from input 2, HIGH resolution, SPLIT polarisation |
| 3 |
• | QC1DB |
MEDIAN |
2.23e+03 |
e/s |
VAL | 1000,4000 |
36 |
fluxavg_sc3 |
this |
last_yr |
all
|
SC flat-field flux from input 3, HIGH resolution, SPLIT polarisation |
| 4 |
• | QC1DB |
MEDIAN |
1.95e+03 |
e/s |
VAL | 1000,4000 |
36 |
fluxavg_sc4 |
this |
last_yr |
all
|
SC flat-field flux from input 4, HIGH resolution, SPLIT polarisation |
| 5 |
• | QC1DB |
MEDIAN |
6.44e+03 |
e/s |
VAL | 1000,6500 |
57 |
fluxavg_sc1 |
this |
last_yr |
all
|
SC flat-field flux from input 1, HIGH resolution, COMBINED polarisation |
| 6 |
• | QC1DB |
MEDIAN |
6e+03 |
e/s |
VAL | 1000,6500 |
57 |
fluxavg_sc2 |
this |
last_yr |
all
|
SC flat-field flux from input 2, HIGH resolution, COMBINED polarisation |
| 7 |
• | QC1DB |
MEDIAN |
3.57e+03 |
e/s |
VAL | 1000,6500 |
57 |
fluxavg_sc3 |
this |
last_yr |
all
|
SC flat-field flux from input 3, HIGH resolution, COMBINED polarisation |
| 8 |
• | QC1DB |
MEDIAN |
3.58e+03 |
e/s |
VAL | 1000,6500 |
57 |
fluxavg_sc4 |
this |
last_yr |
all
|
SC flat-field flux from input 4, HIGH resolution, COMBINED polarisation |
| |
|
*Data sources: QC1DB: QC1 database; LOCAL: local data source
|
Plot 1
scores:  1| 1|
| | data source: | gravity_p2vm
(QC1 database) |
| dataset: | fluxavg_sc1 | • |
| median: | 3.78e+03 | e/s |
| fixed thresholds: | 1000...4000 | e/s |
| N_data plotted: | 36 |
| [click plot for closeup] |
Plot 2
scores: no current data
| | data source: | gravity_p2vm
(QC1 database) |
| dataset: | fluxavg_sc2 | • |
| median: | 3.74e+03 | e/s |
| fixed thresholds: | 1000...4000 | e/s |
| N_data plotted: | 36 |
| [click plot for closeup] |
Plot 3
scores: no current data
| | data source: | gravity_p2vm
(QC1 database) |
| dataset: | fluxavg_sc3 | • |
| median: | 2.23e+03 | e/s |
| fixed thresholds: | 1000...4000 | e/s |
| N_data plotted: | 36 |
| [click plot for closeup] |
Plot 4
scores: no current data
| | data source: | gravity_p2vm
(QC1 database) |
| dataset: | fluxavg_sc4 | • |
| median: | 1.95e+03 | e/s |
| fixed thresholds: | 1000...4000 | e/s |
| N_data plotted: | 36 |
| [click plot for closeup] |
Plot 5
scores: 3|
| | data source: | gravity_p2vm
(QC1 database) |
| dataset: | fluxavg_sc1 | • |
| median: | 6.44e+03 | e/s |
| fixed thresholds: | 1000...6500 | e/s |
| N_data plotted: | 57 |
| [click plot for closeup] |
Plot 6
scores: no current data
| | data source: | gravity_p2vm
(QC1 database) |
| dataset: | fluxavg_sc2 | • |
| median: | 6e+03 | e/s |
| fixed thresholds: | 1000...6500 | e/s |
| N_data plotted: | 57 |
| [click plot for closeup] |
Plot 7
scores: no current data
| | data source: | gravity_p2vm
(QC1 database) |
| dataset: | fluxavg_sc3 | • |
| median: | 3.57e+03 | e/s |
| fixed thresholds: | 1000...6500 | e/s |
| N_data plotted: | 57 |
| [click plot for closeup] |
Plot 8
scores: no current data
| | data source: | gravity_p2vm
(QC1 database) |
| dataset: | fluxavg_sc4 | • |
| median: | 3.58e+03 | e/s |
| fixed thresholds: | 1000...6500 | e/s |
| N_data plotted: | 57 |
| [click plot for closeup] |
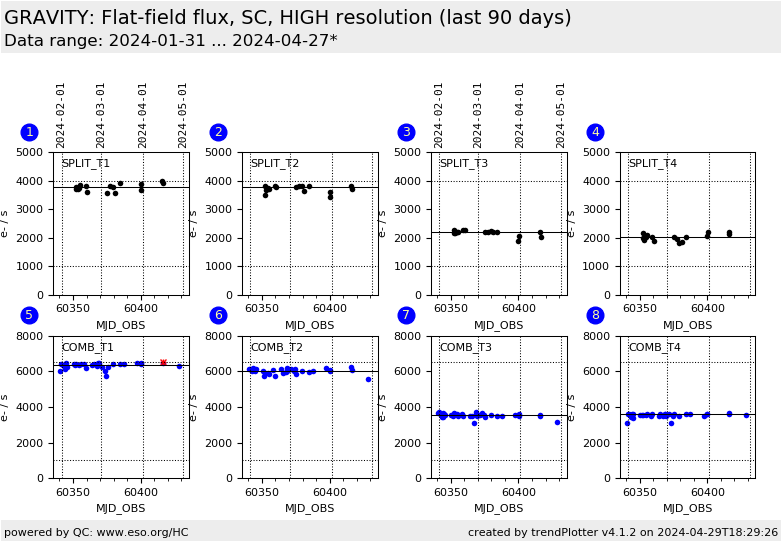
Flux (in e-/s) from the calibration unit in flat-field exposures.
There is one HC plot for each of the six combinations of spectral resolution (low,
medium, or high) and polarimetry (splitted or combined). Separate sub plots
are for the four inputs, and for FT and SC. The flux from the two polarimetric beams
in SPLIT polarimetry are added.
The upper threshold for the SC detector has been set up in order to indicate
saturation.
General information
Click on any of the plots to see a close-up version.
The latest date is indicated on top of the plot.
If configured,
- data points belonging to the latest date are specially marked
- statistical averages are indicated by a solid line, and thresholds by broken lines
- outliers are marked by a red asterisk. They are defined as data points outside the
threshold lines
- "aliens" (= data points outside the plot Y limits) are marked by a red arrow (↑ or ↓)
- you can download the data for each parameter set if the 'Data downloads' link shows up
|
