Plot
? |
Symb
? |
Source
* |
Average ? |
Thresholds ? |
N_
data |
QC1
parameter |
Data
downloads |
Remarks |
| method |
value |
unit |
method |
value |
| 1 |
• | QC1DB |
MEDIAN |
11.4 |
ADU |
VAL | 11.0,12.0 |
3 |
biasavg_sc |
this |
last_yr |
all
|
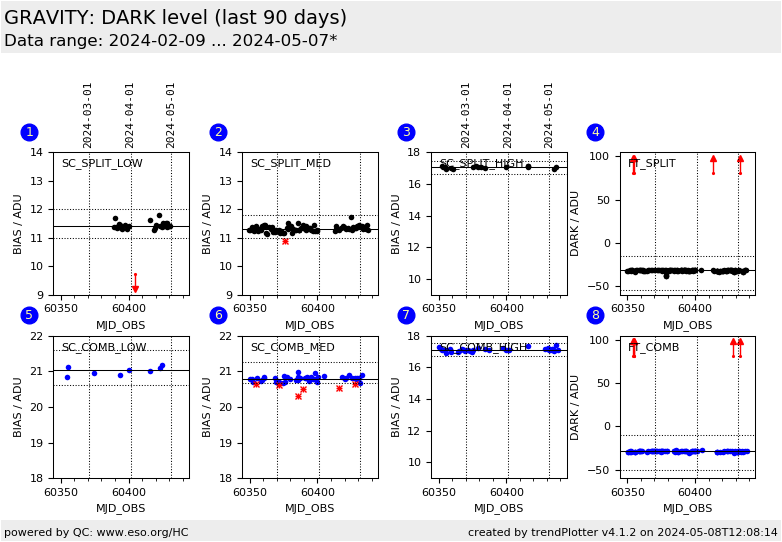
mean bias level, LOW resolution, Science Camera (SC) detector, SPLIT polarisation, DIT=0.3 sec |
| 2 |
• | QC1DB |
MEDIAN |
11.3 |
ADU |
VAL | 10.90,11.70 |
98 |
biasavg_sc |
this |
last_yr |
all
|
mean bias level, MEDIUM resolution, Science Camera (SC) detector, SPLIT polarisation, DIT=0.3 sec |
| 3 |
• | QC1DB |
MEDIAN |
17 |
ADU |
VAL | 16.65,17.45 |
26 |
biasavg_sc |
this |
last_yr |
all
|
mean bias level, HIGH resolution, Science Camera (SC) detector, SPLIT polarisation, DIT=0.3 sec |
| 4 |
• | QC1DB |
MEDIAN |
-31.3 |
ADU |
VAL | -55,-15 |
127 |
darklevel_ft |
this |
last_yr |
all
|
mean dark level, Fringe Tracker (FT) detector, SPLIT polarisation, DIT=0.00085 sec |
| 5 |
• | QC1DB |
MEDIAN |
21.1 |
ADU |
VAL | 20.6,21.6 |
8 |
biasavg_sc |
this |
last_yr |
all
|
mean bias level, LOW resolution, Science Camera (SC) detector, COMBINED polarisation, DIT=0.3 sec |
| 6 |
• | QC1DB |
MEDIAN |
20.8 |
ADU |
VAL | 20.40,21.00 |
58 |
biasavg_sc |
this |
last_yr |
all
|
mean bias level, MEDIUM resolution, Science Camera (SC) detector, COMBINED polarisation, DIT=0.3 sec |
| 7 |
• | QC1DB |
MEDIAN |
17.1 |
ADU |
VAL | 16.7,17.5 |
49 |
biasavg_sc |
this |
last_yr |
all
|
mean bias level, HIGH resolution, Science Camera (SC) detector, COMBINED polarisation, DIT=0.3 sec |
| 8 |
• | QC1DB |
MEDIAN |
-28.5 |
ADU |
VAL | -50,-10 |
115 |
darklevel_ft |
this |
last_yr |
all
|
mean dark level, Fringe Tracker (FT) detector, COMBINED polarisation, DIT=0.00085 sec |
| |
|
*Data sources: QC1DB: QC1 database; LOCAL: local data source
|
Plot 1
scores: no current data
| | data source: | gravity_dark
(QC1 database) |
| dataset: | biasavg_sc | • |
| median: | 11.4 | ADU |
| fixed thresholds: | 11.0...12.0 | ADU |
| N_data plotted: | 3 |
| [click plot for closeup] |
Plot 2
scores:  13| 13|
| | data source: | gravity_dark
(QC1 database) |
| dataset: | biasavg_sc | • |
| median: | 11.3 | ADU |
| fixed thresholds: | 10.9...11.7 | ADU |
| N_data plotted: | 98 |
| [click plot for closeup] |
Plot 3
scores: 2|
| | data source: | gravity_dark
(QC1 database) |
| dataset: | biasavg_sc | • |
| median: | 17 | ADU |
| fixed thresholds: | 16.65...17.45 | ADU |
| N_data plotted: | 26 |
| [click plot for closeup] |
Plot 4
scores: 14|
| | data source: | gravity_dark
(QC1 database) |
| dataset: | darklevel_ft | • |
| median: | -31.3 | ADU |
| fixed thresholds: | -55...-15 | ADU |
| N_data plotted: | 127 |
| [click plot for closeup] |
Plot 5
scores: 1|
| | data source: | gravity_dark
(QC1 database) |
| dataset: | biasavg_sc | • |
| median: | 21.1 | ADU |
| fixed thresholds: | 20.6...21.6 | ADU |
| N_data plotted: | 8 |
| [click plot for closeup] |
Plot 6
scores: 6|
| | data source: | gravity_dark
(QC1 database) |
| dataset: | biasavg_sc | • |
| median: | 20.8 | ADU |
| fixed thresholds: | 20.4...21.0 | ADU |
| N_data plotted: | 58 |
| [click plot for closeup] |
Plot 7
scores: 4|
| | data source: | gravity_dark
(QC1 database) |
| dataset: | biasavg_sc | • |
| median: | 17.1 | ADU |
| fixed thresholds: | 16.7...17.5 | ADU |
| N_data plotted: | 49 |
| [click plot for closeup] |
Plot 8
scores: 7|
| | data source: | gravity_dark
(QC1 database) |
| dataset: | darklevel_ft | • |
| median: | -28.5 | ADU |
| fixed thresholds: | -50...-10 | ADU |
| N_data plotted: | 115 |
| [click plot for closeup] |
Trending plots for dark exposures of the Fringe Tracker (FT) and Science Camera
(SC) detectors. Plotted are the dark level (FT), the bias level (SC),
and the RMS of the master darks (both). The dark level is determined from the
master dark whereas the bias is determined from the input raw frames and
subtracted when creating the master in case of the SC detector.
The SC detector features a windowed read-out that depends on the spectral
resolution (low, medium, or high) and on the polarimetry mode (splitted or
combined). QC parameters from darks are only plotted for
SC DITs of 0.3 sec and FT DITs of 0.00085 sec,
respectively. For the dark level, only darks taken together with the P2VM calibrations are
selected. These have FDDL WINDOW = 0.1 (only available since 2019-05-01 in the database).
General information
Click on any of the plots to see a close-up version.
The latest date is indicated on top of the plot.
If configured,
- data points belonging to the latest date are specially marked
- statistical averages are indicated by a solid line, and thresholds by broken lines
- outliers are marked by a red asterisk. They are defined as data points outside the
threshold lines
- "aliens" (= data points outside the plot Y limits) are marked by a red arrow (↑ or ↓)
- you can download the data for each parameter set if the 'Data downloads' link shows up
|
