Plot
? |
Symb
? |
Source
* |
Average ? |
Thresholds ? |
N_
data |
QC1
parameter |
Data
downloads |
Remarks |
| method |
value |
unit |
method |
value |
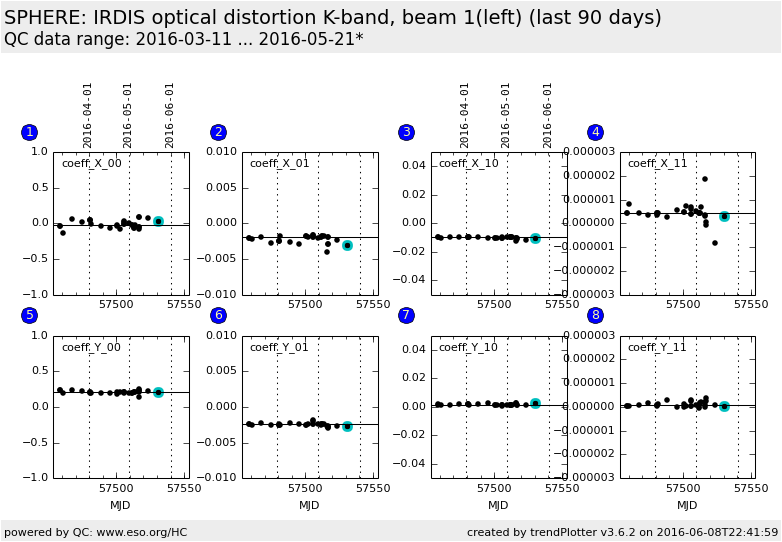
| 1 |
• | QC1DB |
MEDIAN |
-0.021211 |
NONE |
none | |
31 |
coeff_x_0_0 |
this |
last_yr |
all
|
opt. dist. pol. coeff. |
| 2 |
• | QC1DB |
MEDIAN |
-0.0019645 |
NONE |
none | |
31 |
coeff_x_0_1 |
this |
last_yr |
all
|
opt. dist. pol. coeff. |
| 3 |
• | QC1DB |
MEDIAN |
-0.0097796 |
NONE |
none | |
31 |
coeff_x_1_0 |
this |
last_yr |
all
|
opt. dist. pol. coeff. |
| 4 |
• | QC1DB |
MEDIAN |
4.33025e-07 |
NONE |
none | |
31 |
coeff_x_1_1 |
this |
last_yr |
all
|
opt. dist. pol. coeff. |
| 5 |
• | QC1DB |
MEDIAN |
0.20558 |
NONE |
none | |
31 |
coeff_y_0_0 |
this |
last_yr |
all
|
opt. dist. pol. coeff. |
| 6 |
• | QC1DB |
MEDIAN |
-0.00247377 |
NONE |
none | |
31 |
coeff_y_0_1 |
this |
last_yr |
all
|
opt. dist. pol. coeff. |
| 7 |
• | QC1DB |
MEDIAN |
0.00156691 |
NONE |
none | |
31 |
coeff_y_1_0 |
this |
last_yr |
all
|
opt. dist. pol. coeff. |
| 8 |
• | QC1DB |
MEDIAN |
7.764e-08 |
NONE |
none | |
31 |
coeff_y_1_1 |
this |
last_yr |
all
|
opt. dist. pol. coeff. |
| |
|
*Data sources: QC1DB: QC1 database; LOCAL: local data source
|
Plot 1
scores: not implemented
| | data source: | sphere_irdis_distmap
(QC1 database) |
| dataset: | coeff_x_0_0 | • |
| median: | -0.021211 | NONE |
| thresholds: | none | |
| N_data plotted: | 31 |
| [click on plot for closeup] |
Plot 2
scores: not implemented
| | data source: | sphere_irdis_distmap
(QC1 database) |
| dataset: | coeff_x_0_1 | • |
| median: | -0.0019645 | NONE |
| thresholds: | none | |
| N_data plotted: | 31 |
| [click on plot for closeup] |
Plot 3
scores: not implemented
| | data source: | sphere_irdis_distmap
(QC1 database) |
| dataset: | coeff_x_1_0 | • |
| median: | -0.0097796 | NONE |
| thresholds: | none | |
| N_data plotted: | 31 |
| [click on plot for closeup] |
Plot 4
scores: not implemented
| | data source: | sphere_irdis_distmap
(QC1 database) |
| dataset: | coeff_x_1_1 | • |
| median: | 4.33025e-07 | NONE |
| thresholds: | none | |
| N_data plotted: | 31 |
| [click on plot for closeup] |
Plot 5
scores: not implemented
| | data source: | sphere_irdis_distmap
(QC1 database) |
| dataset: | coeff_y_0_0 | • |
| median: | 0.20558 | NONE |
| thresholds: | none | |
| N_data plotted: | 31 |
| [click on plot for closeup] |
Plot 6
scores: not implemented
| | data source: | sphere_irdis_distmap
(QC1 database) |
| dataset: | coeff_y_0_1 | • |
| median: | -0.00247377 | NONE |
| thresholds: | none | |
| N_data plotted: | 31 |
| [click on plot for closeup] |
Plot 7
scores: not implemented
| | data source: | sphere_irdis_distmap
(QC1 database) |
| dataset: | coeff_y_1_0 | • |
| median: | 0.00156691 | NONE |
| thresholds: | none | |
| N_data plotted: | 31 |
| [click on plot for closeup] |
Plot 8
scores: not implemented
| | data source: | sphere_irdis_distmap
(QC1 database) |
| dataset: | coeff_y_1_1 | • |
| median: | 7.764e-08 | NONE |
| thresholds: | none | |
| N_data plotted: | 31 |
| [click on plot for closeup] |
This plot show the optiocal distortion coefficient X_1_0 and Y_0_1 as a function of the IFS bench temperature.
The polynomial to correct the shifts in x direction is:
Delta X = X_0_0 + X_1_0 * x + X_0_1 * y + X_1_1 * x * y + ...
and for the shifts in y-direction:
Delta Y = Y_0_0 + Y_1_0 * x + Y_0_1 * y + Y_1_1 * x * y + ...
Hence X_1_0 is the first order linear scale (the plate scale) in x-direction and
Y_0_1 is the first order scale in y-direction.
General information
Click on any of the plots to see a close-up version.
The latest date is indicated on top of the plot.
If configured,
- data points belonging to the latest date are specially marked
- statistical averages are indicated by a solid line, and thresholds by broken lines
- outliers are marked by a red asterisk. They are defined as data points outside the
threshold lines
- "aliens" (= data points outside the plot Y limits) are marked by a red arrow (↑ or ↓)
- you can download the data for each parameter set if the 'Data downloads' link shows up
|
