We calculate the wavelength solution and measure the quality of the wavelength calibration solution. It is based on QC1 parameters of two sets of WAVECAL data, 1 set in BLUE mode and 1 set in RED mode, each set comprising a single RAW frame. Depending of wavelength setting ,the data are recorded every day or on another time scale.
Note that in contrast to fibres 2-8 which are illuminated by the robotic fibre projector fed by a Thorium-Argon lamp, fibre 1 is illuminated by the simultaneous calibration wavelength calibration lamp.
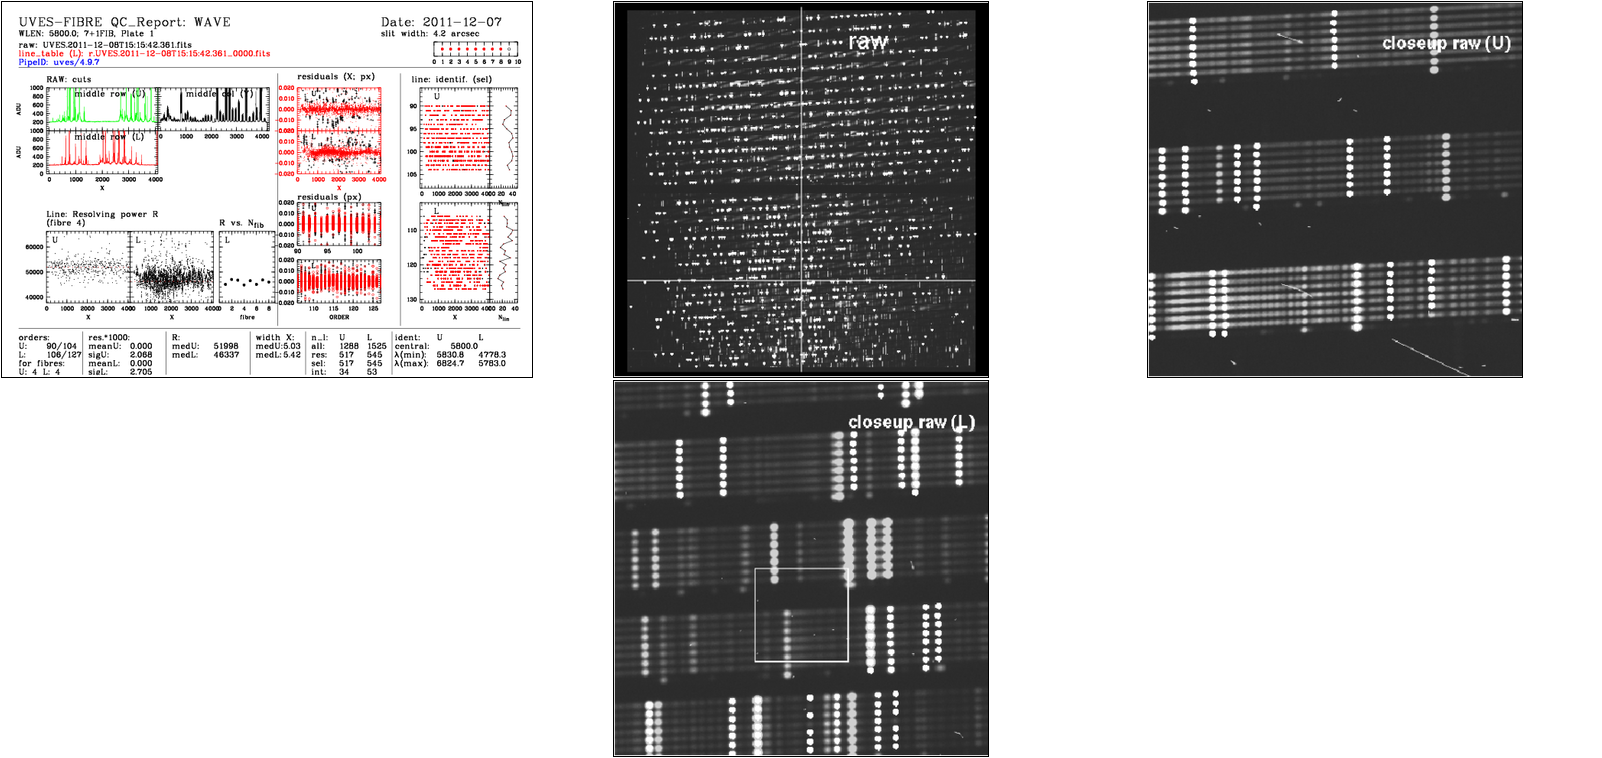
plot 1:trace across the middle row of the UPPER chip RAW frame
plot 2:trace across the middle column of the RAW frames (ie both chips 'stuck together')
plot 3:trace across the middle row of the LOWER chip RAW frame
plot 4:For Fibre 4 (arbitrarily selected as representative), measured resolving power of each line used in the solution for the UPPER chip as a function of X
plot 5:For Fibre 4 (arbitrarily selected as representative), measured resolving power of each line used in the solution for the LOWER chip as a function of X
box 2, top to bottom:
plot 6:For Fibre 4 (arbitrarily selected as representative), residuals of measured line positions with respect to the physical model for the UPPER chip as a function of X pixels coordinate; for the lines included in the final solution (red crosses) and those not included in the final solution (black crosses)
plot 7:For Fibre 4 (arbitrarily selected as representative), residuals of measured line positions with respect to the physical model for the LOWER chip as a function of X pixels coordinate; for the lines included in the final solution (red crosses) and those not included in the final solution (black crosses)
plot 8:For Fibre 4 (arbitrarily selected as representative), residuals of measured line positions with respect to the physical model for the UPPER chip as a function of order number; for the lines included in the final solution (red crosses) and those not included in the final solution (black crosses)
plot 9:For Fibre 4 (arbitrarily selected as representative), residuals of measured line positions with respect to the physical model for the LOWER chip as a function of order number; for the lines included in the final solution (red crosses) and those not included in the final solution (black crosses)
box 3, top to bottom:
plot 10:For Fibre 4 (arbitrarily selected as representative), pixel-space representation of found but not used (black) and found and used (red) in the solution lines as a function of order for the UPPER chip
plot 11:For Fibre 4 (arbitrarily selected as representative), pixel-space representation of found but not used (black) and found and used (red) in the solution lines as a function of order for the UPPER chip
Scoring thresholds have been set with an offset from the median for some plots (Resolving power, WLmin and Max) or as fixed values (for the dispersion).
In theorie the thresholds should be set for the Resolving Power to the value found in teh user manual
The trending of the Wave parameters during the life time of the instrument is best be seen with the full history trending plots shown here: FULL history.
resid_avg, resid_rms: mean and sigma of the line positions to fit. These parameters are useful to check precision of wavelength calibration solution.
resol_med, resol_rms: measured median iand sigma of the resolving power of lines selected
fwhm_med, fwhm_rms: measured median and sigma FWHM in X of lines selected
nlin_tot: total number of lines found
nlin_res: Number of lines with residual < 0.1 nm. This number gives an idea of the precision of the final solution. The higher the number the more precise is the solution.
nlin_sel: number of lines selected which could be cross-identified with the catalogue
nlin_sol: number of lines identified and accepted for determining the final wavelength calibration solution
nlin_tot_1stiter: The Pipeline automatically adjusts the line detection threshold iteratively until it detects a number of lines between the --minlines and --maxlines command line parametres of the recipe. This is the number of lines detected in the FIRST iteration, and so is less sensitive to pipeline artifacts
nlin_niter is the number of lines used threshold adjustment iterations required to arrive at final solution
nlin_int: number of lines selected in ThAr intensity check
int_avg: average intensity of ThAr lines (divided by EXPTIME) of the selected line list.
 Parameters trended