Quality Control and
Data Processing
|
SINFONI: Interventions
In general, following each instrument intervention, a full complement of calibration frames (darks, flats, wavelengths, linearity, distortions, fibre-fed HCAO, telluric standard star, PSF star, and pupil images) are obtained.
 Issues and Problems
For all data after 2011-06-08:
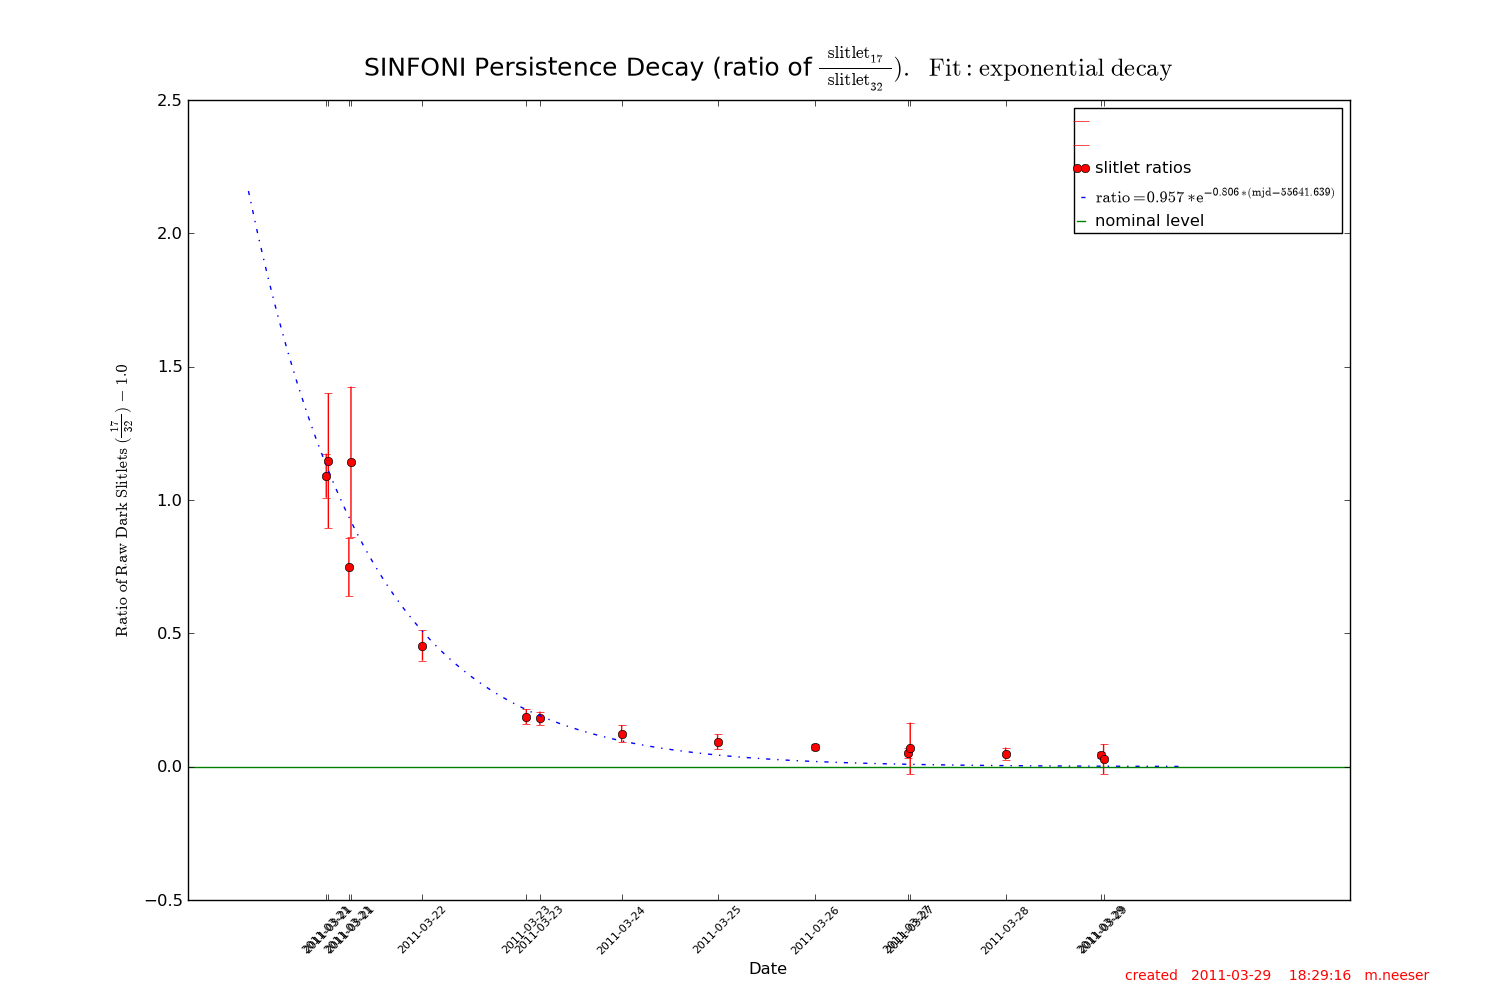
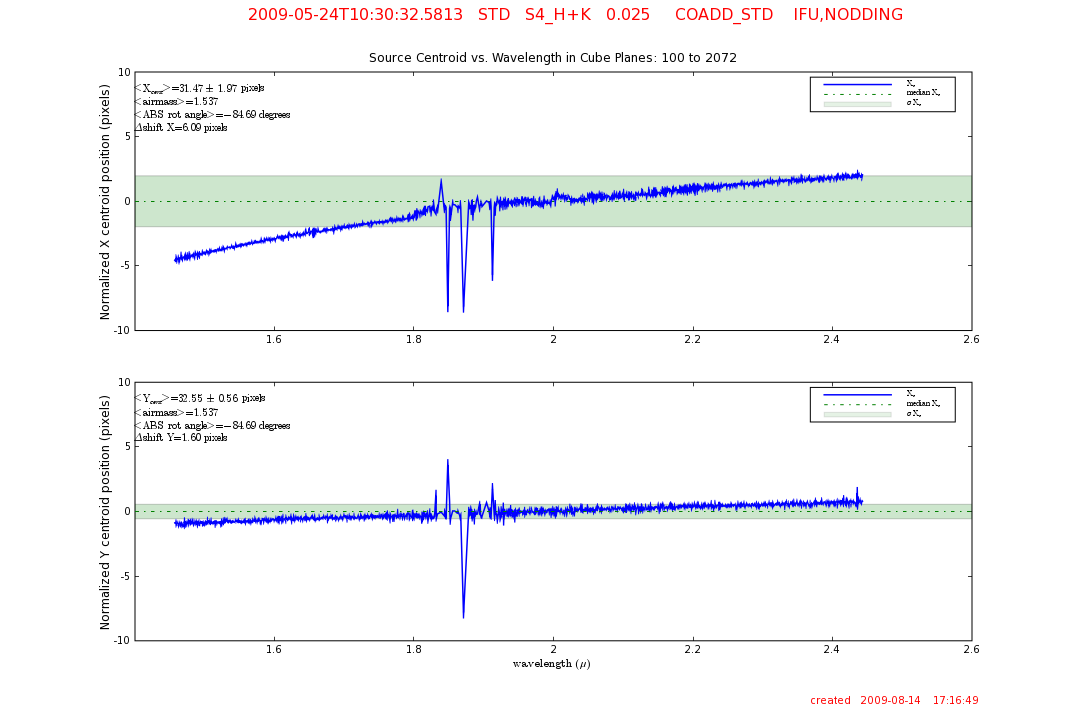
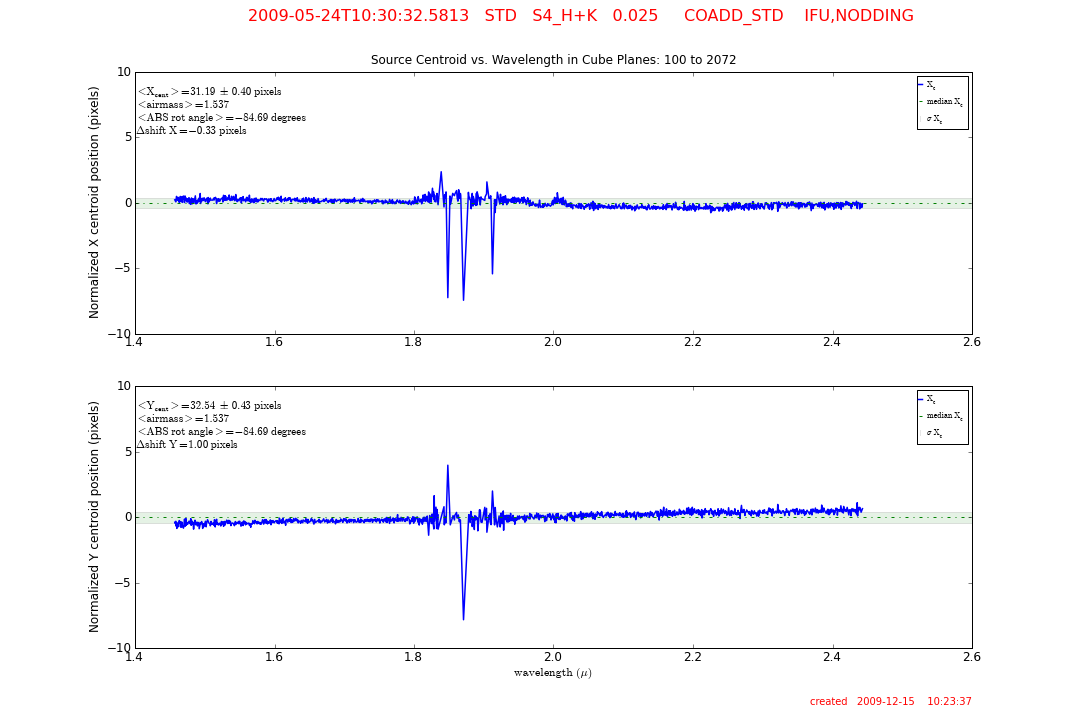
between 2011-03-20 and 2011-03-25 (P86) SINFONI darks were showing evidence of persistence. The recovery from this episode of persistence took more that five days to diminish to near pre-persistence levels. The decay rate is typically exponential, as can be seen in this plot of the ratio of the median flux levels between slitlet 17 and slitlet 32 versus date: from 2009-12-09 (P84) sinfoni pipeline version 2.1.0: This pipeline version incorporates a major improvement in the sinfo_rec_jitter recipe. For all grism (J, H, K, and H+K) and for the pixel scales 25 and 100 mas, the data cubes are now corrected for atmospheric dispersion. Depending on the airmass and ADA rotation angle the source centroid can shift from one wavelength end of the cube to the other by several pixels. For the largest wavelength range cube (i.e. for the H+K band) and at the smallest pixel scale, this shift could be as large as 6-8 pixels. This shift is now corrected within sinfo_rec_jitter and is applied to the telluric STD star cubes, the PSF standard star cubes, and to all science cubes. For the 250 mas pixel scale, no correction is applied. This is due to the fact that the shift from atmospheric dispersion is less than 1 pixel at this pixel scale. The atmospheric dispersion correction relies on additional fits tables that provide the size of the correction based on airmass, waveband, and pixel scale. These files are available in the pipeline distribution (2.1.0).
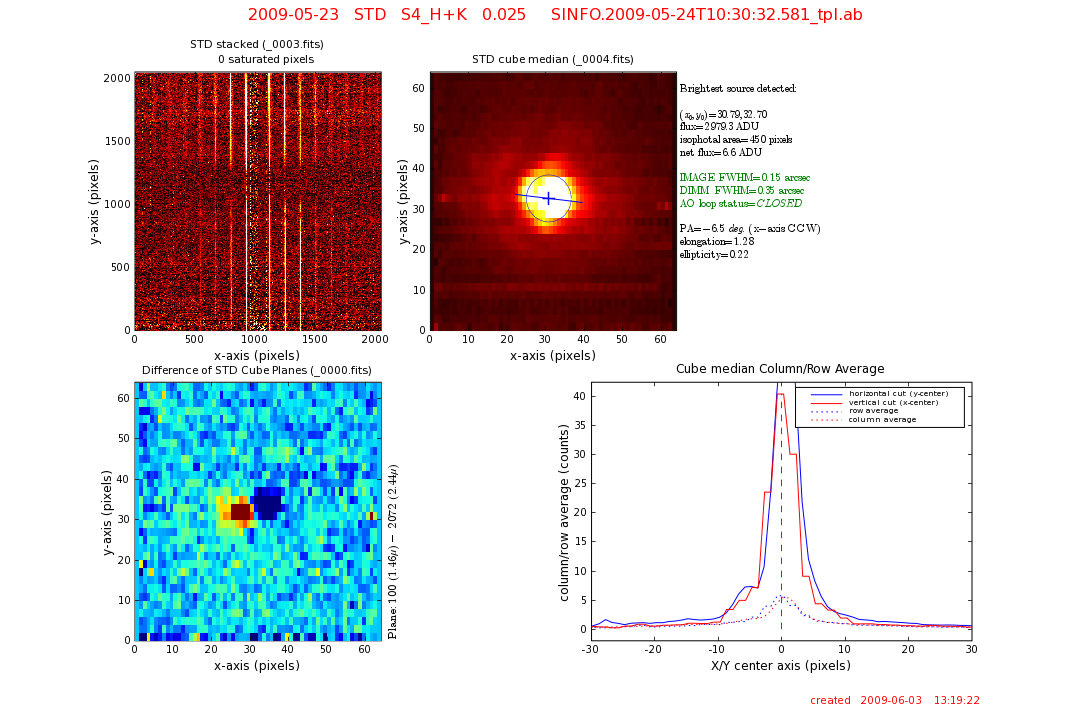
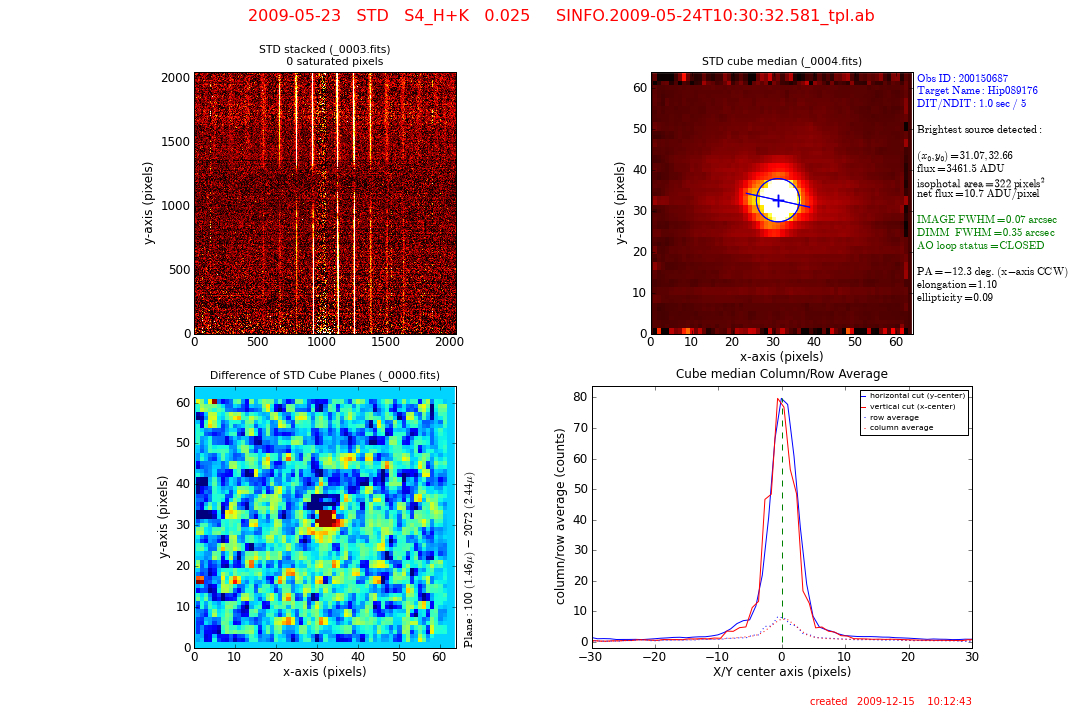
These frames show the same telluric STD star cube without an atmospheric dispersion correction (two left-most frames) and with an atmospheric dispersion correction (two right-most frames). The top plots show the relative position of the stellar centroid as a function of wavelength in the X and Y axis directions. The overall X offset in the uncorrected cube is more than 6 pixels, while for the corrected cube this offset is about 0.3 pixels. This shift can also been seen in the image difference between cube plane 100 and cube plane 2079, as is shown on the bottom left of the two bottom frames (blue-colour images).
2009-01-01 to PRESENT DATE: Important note for science observations with a large number of input frames:
2007-11-13 to PRESENT DATE Occasionally, the SINFONI distortion
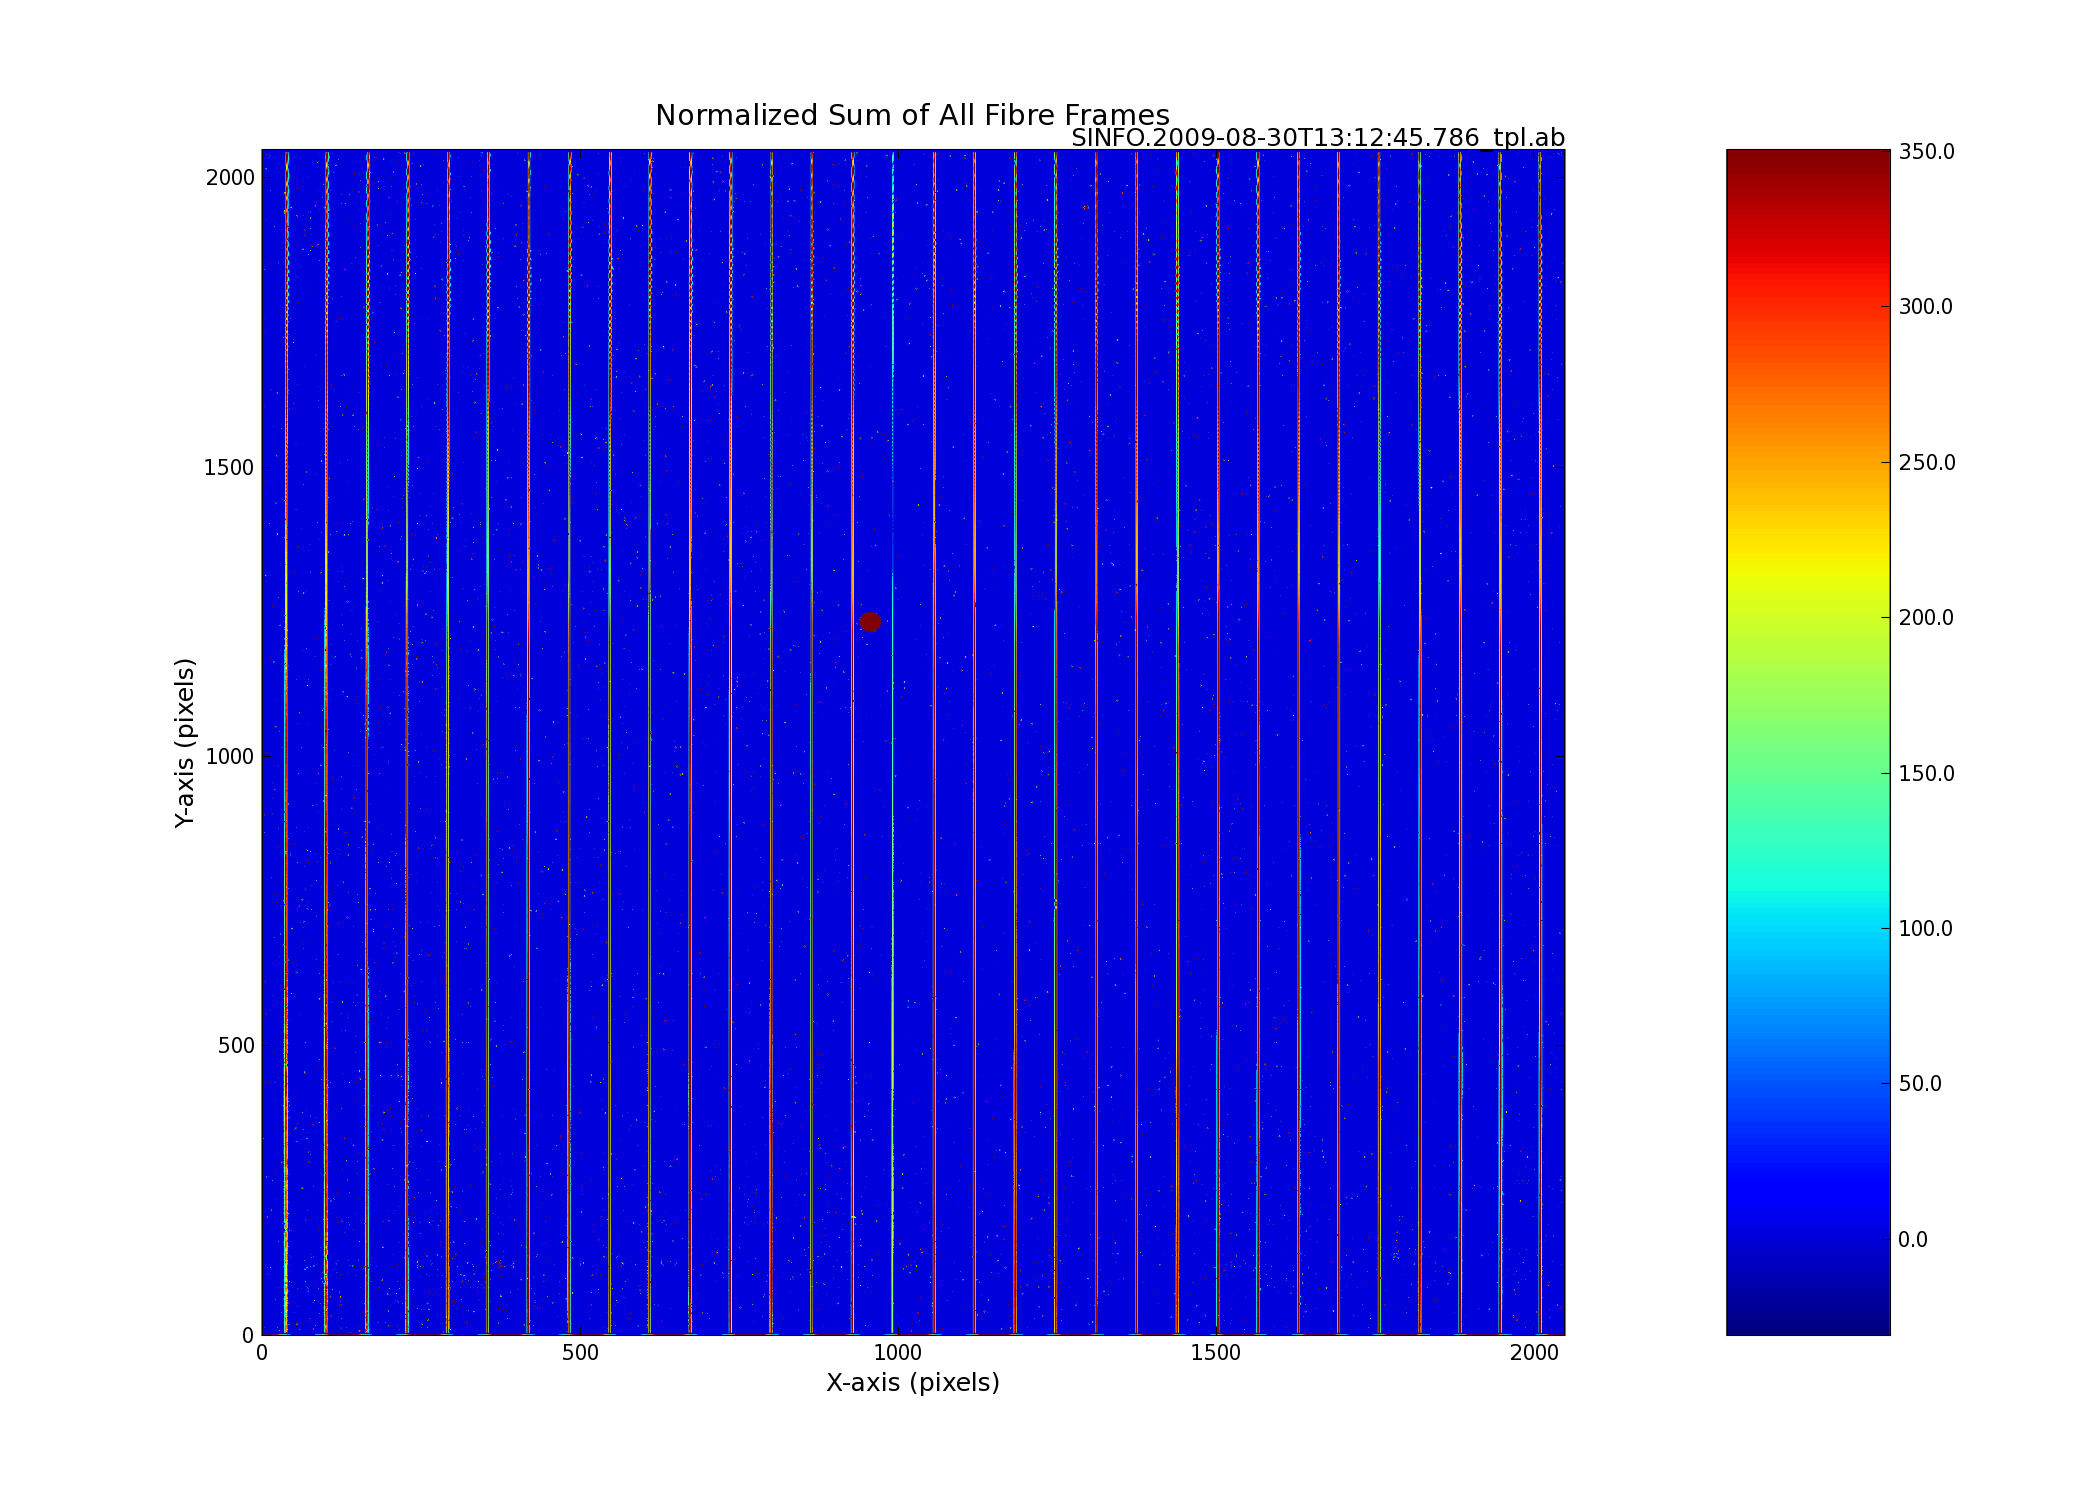
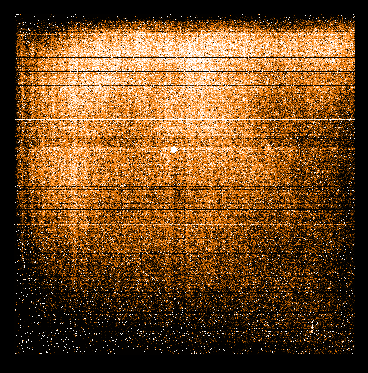
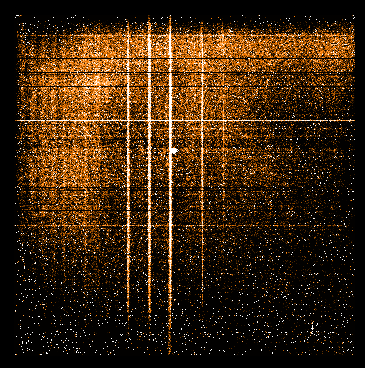
frames will fail. This is not apparent at the time the OB is executed, but will only become evident when the distortion OB is pipeline processed. This failure manifests itself in fibre traces that are missing in some of the pseudo slits, do not cover the full length of the detector, or are too faint. As a result the pipeline cannot fit the full fibre traces and fails. These faulty distortions are found in roughly 10% of all distortions obtained.
These bad distortions are detected by QC and a request is then made to Paranal to repeat them. To prevent users from downloading faulty distortions, the associated raw frames are hidden in the archive.
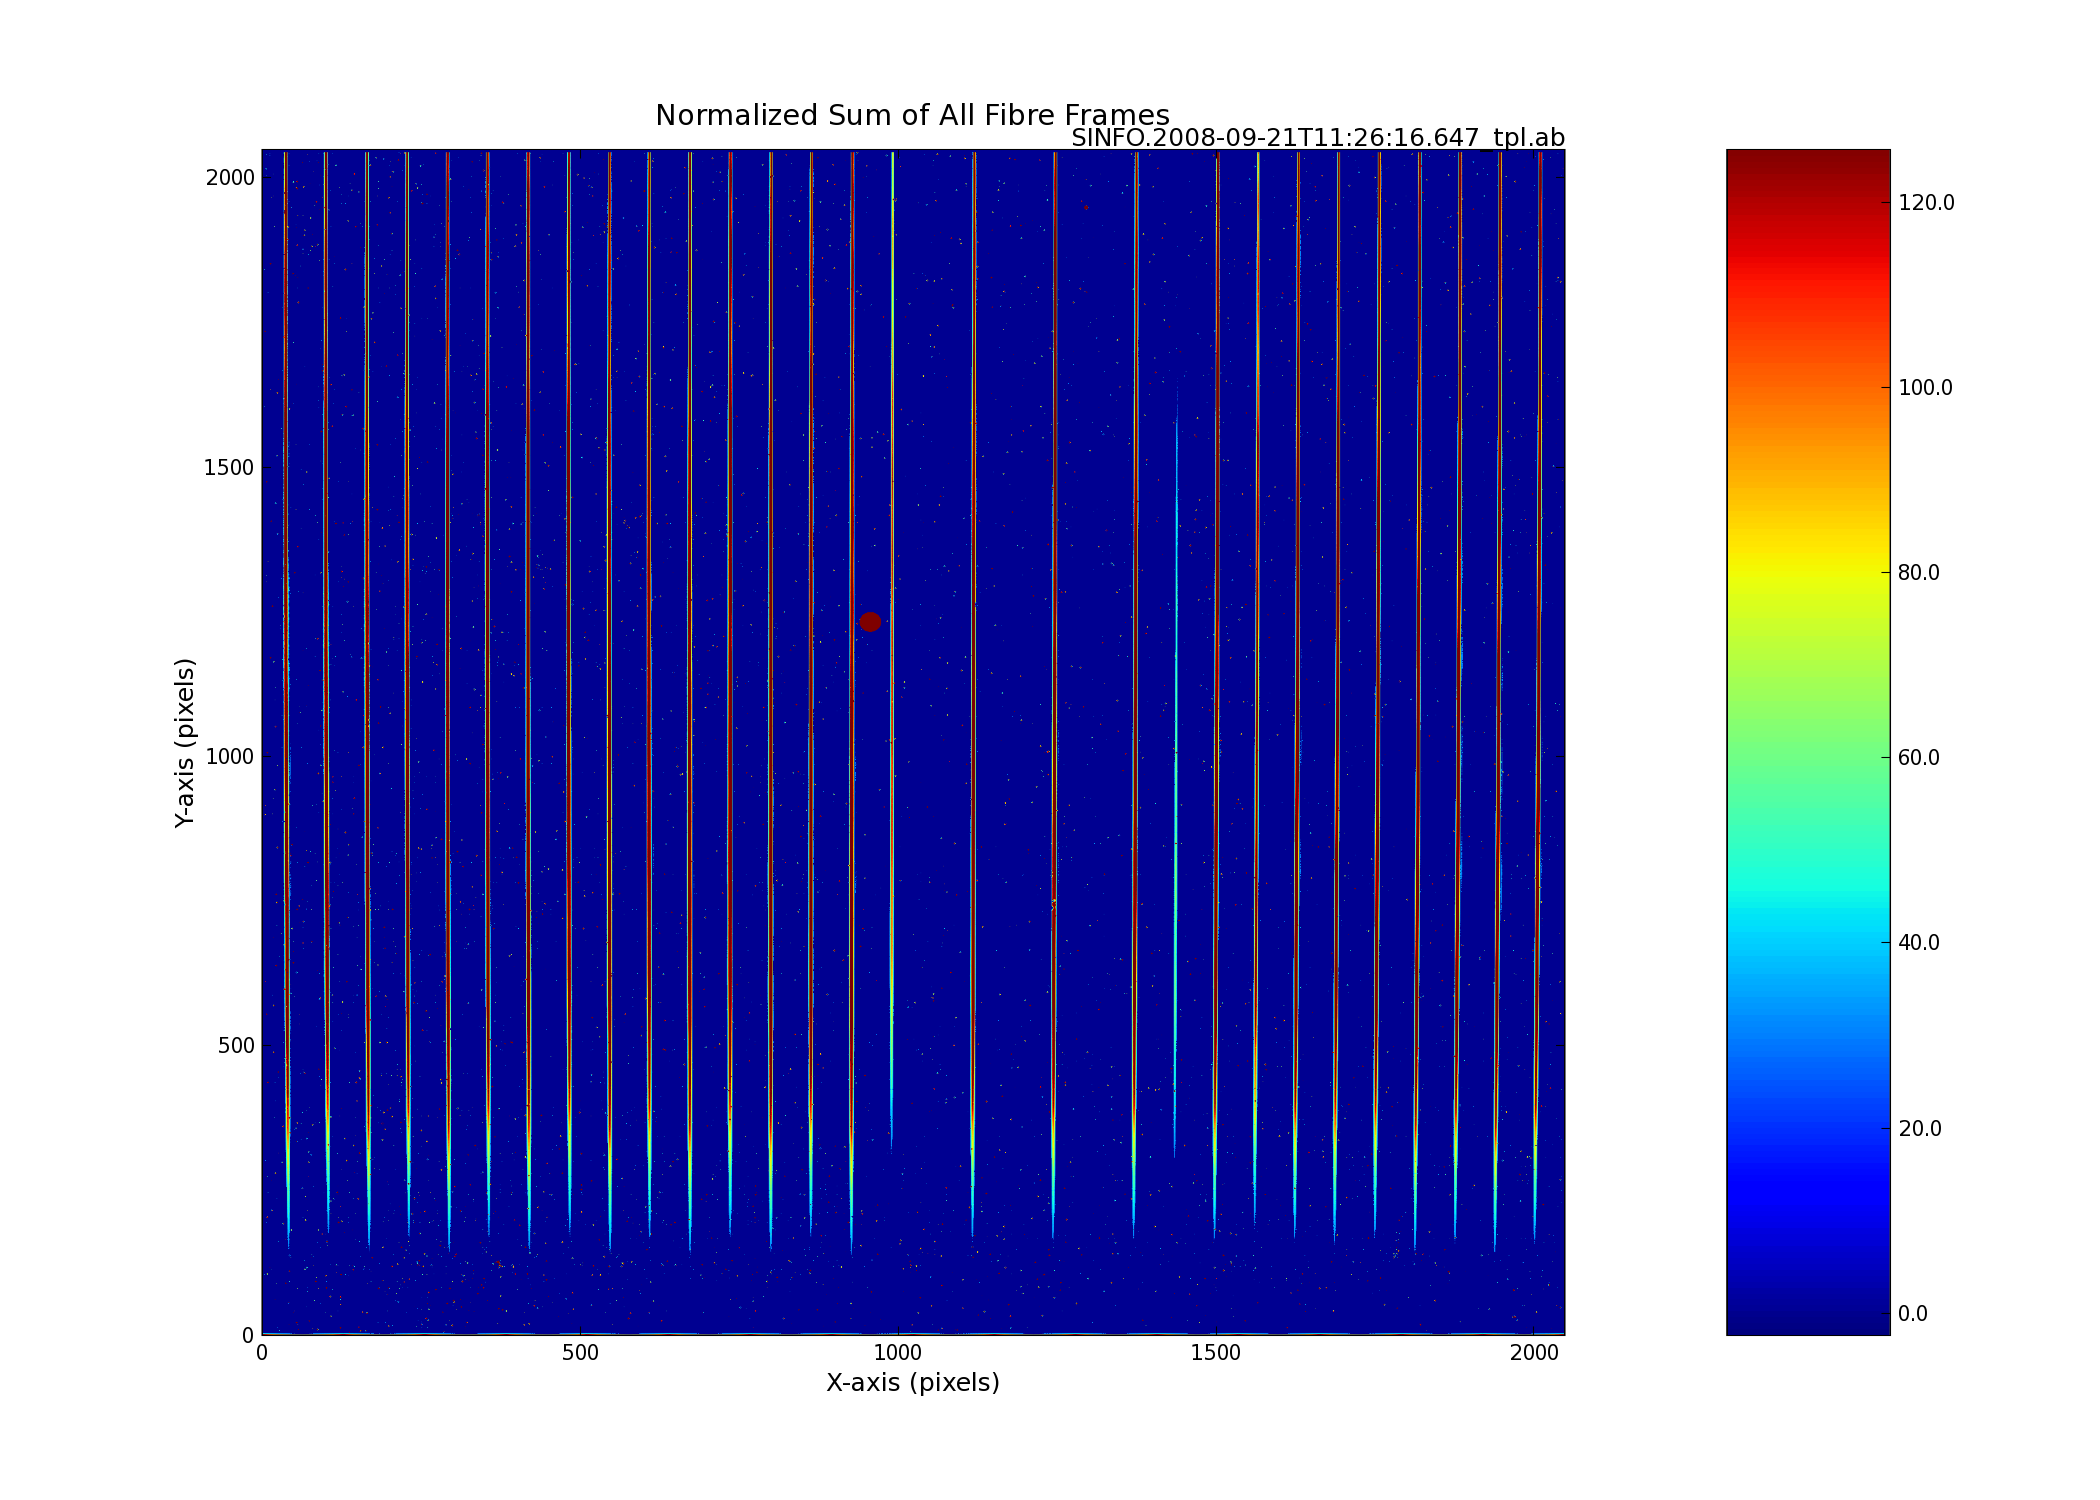
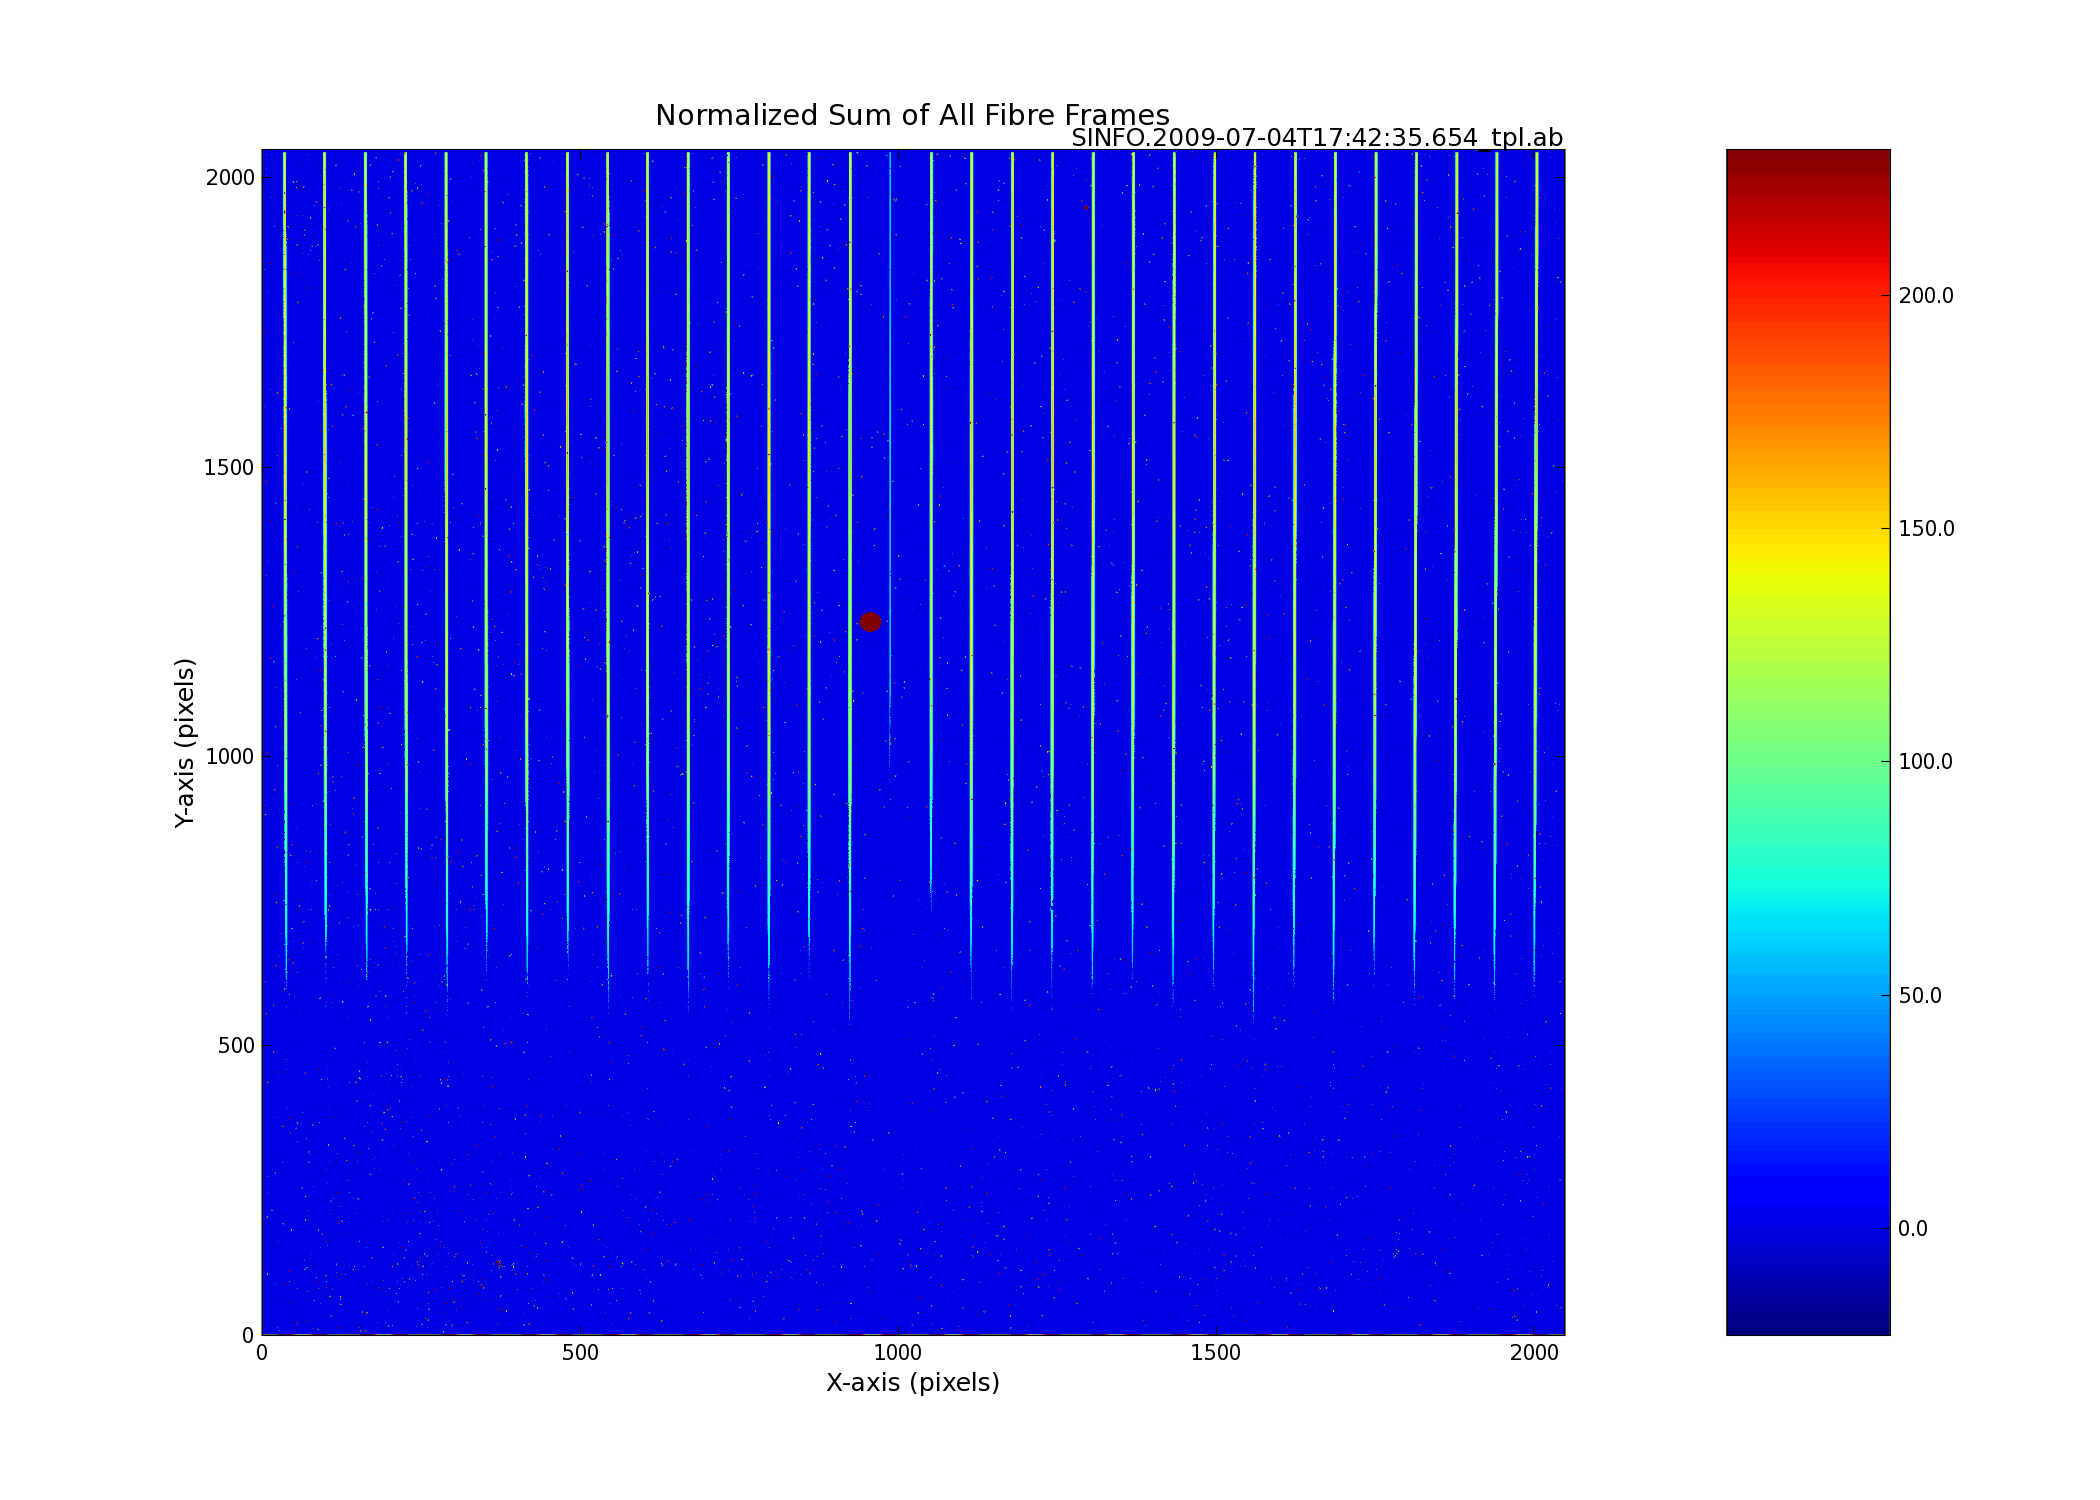
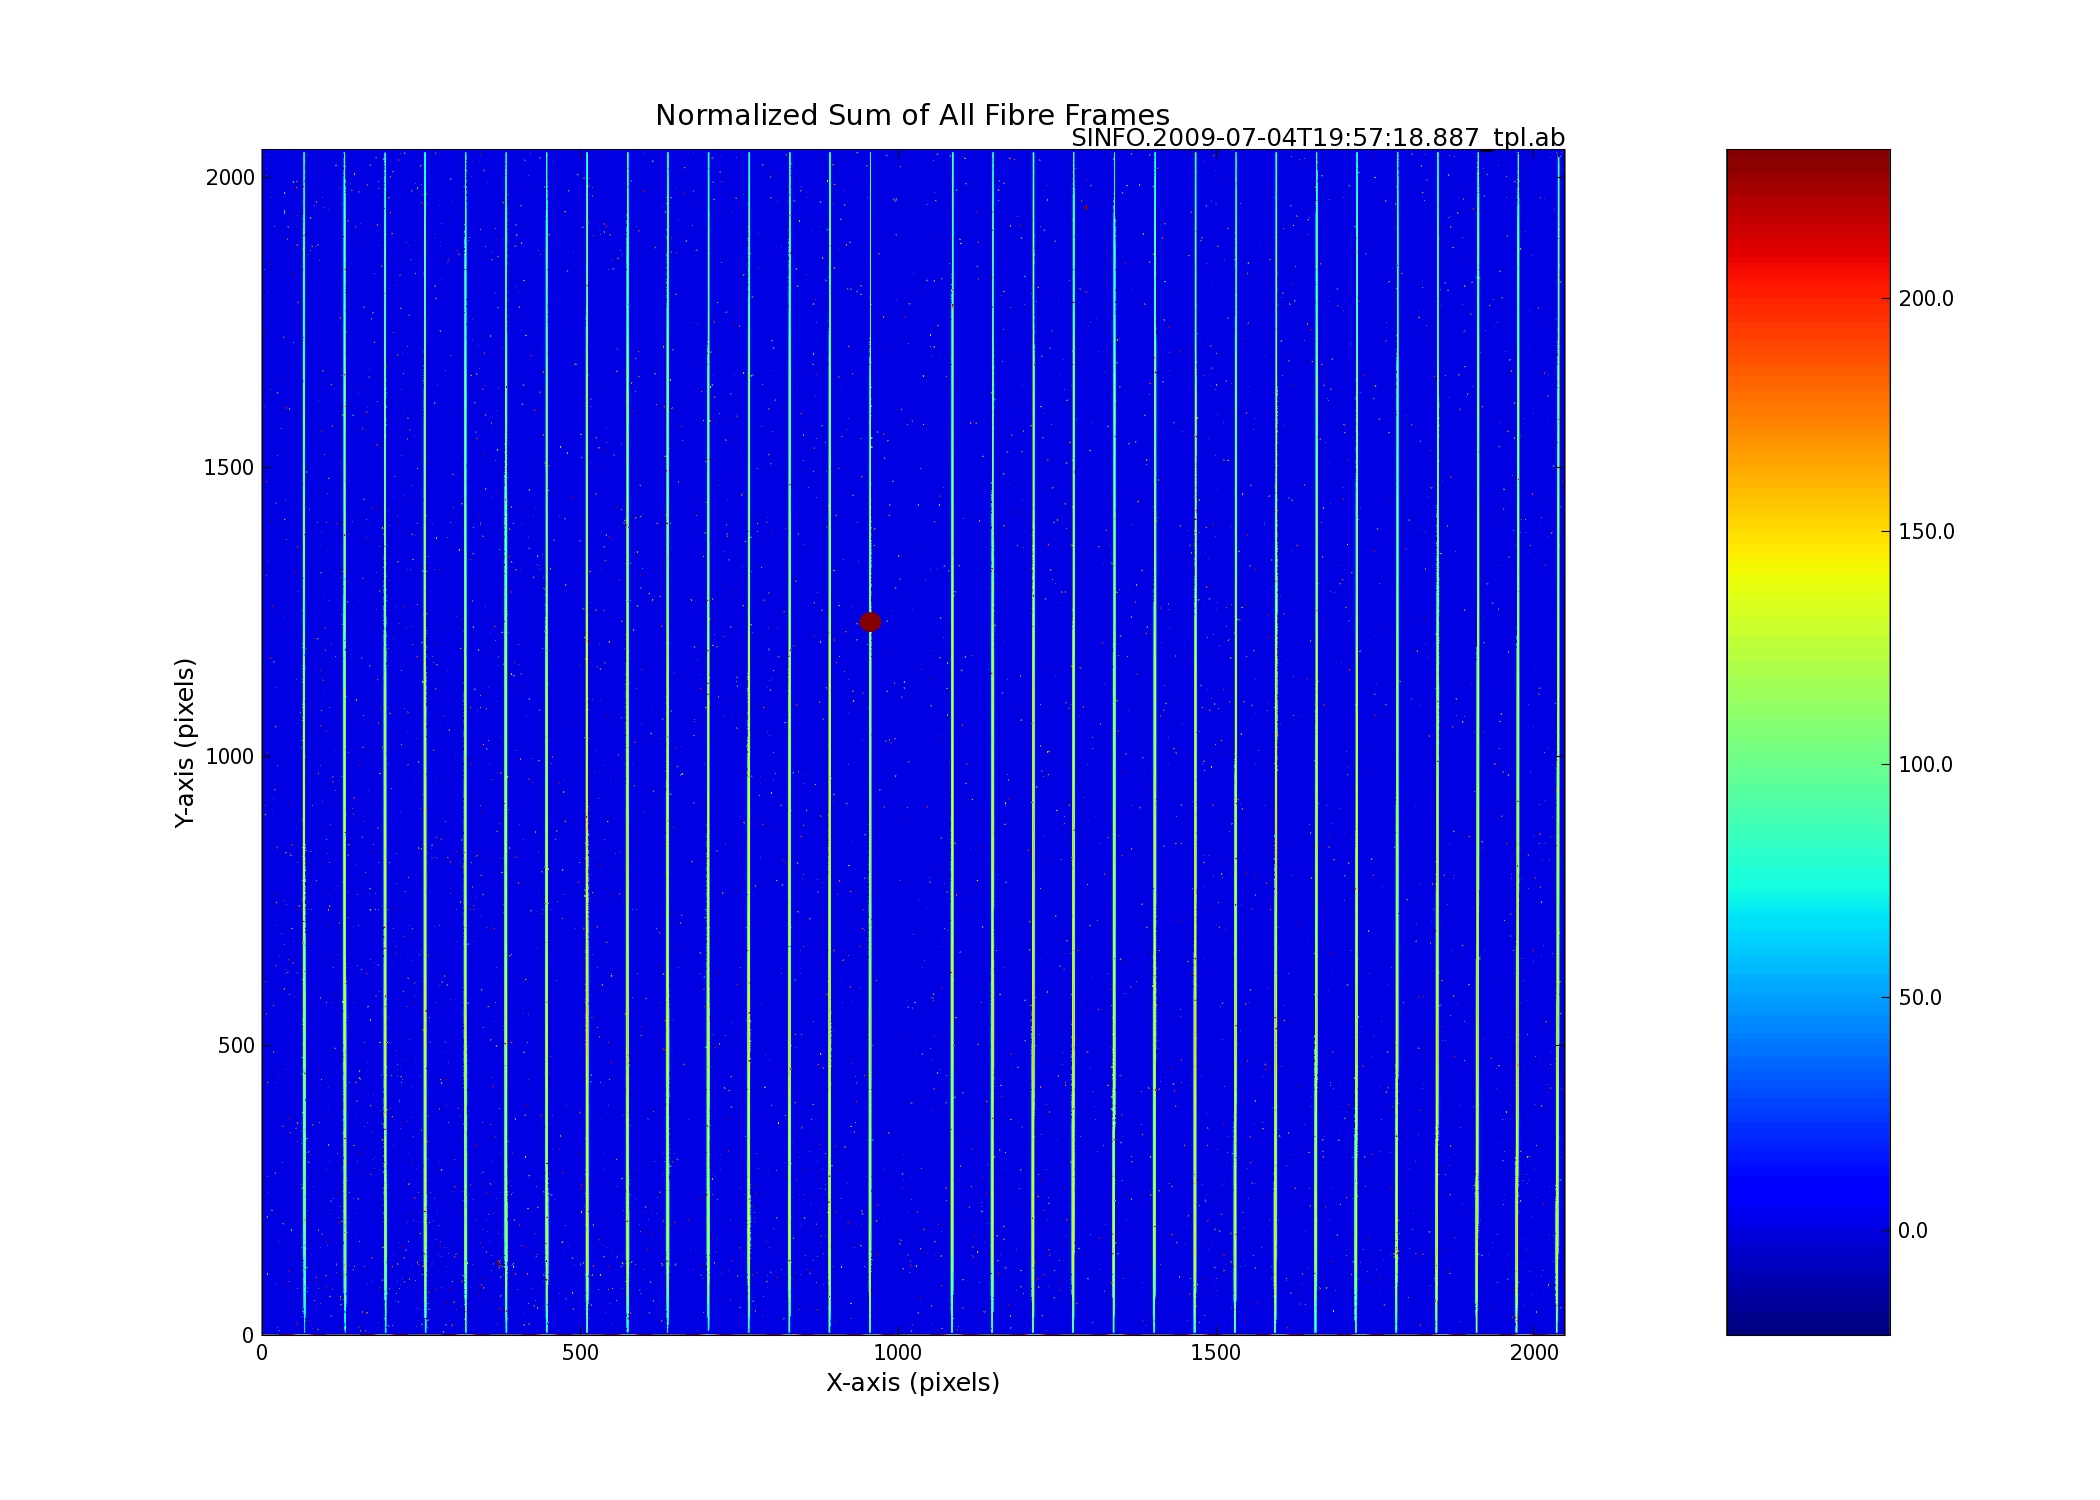
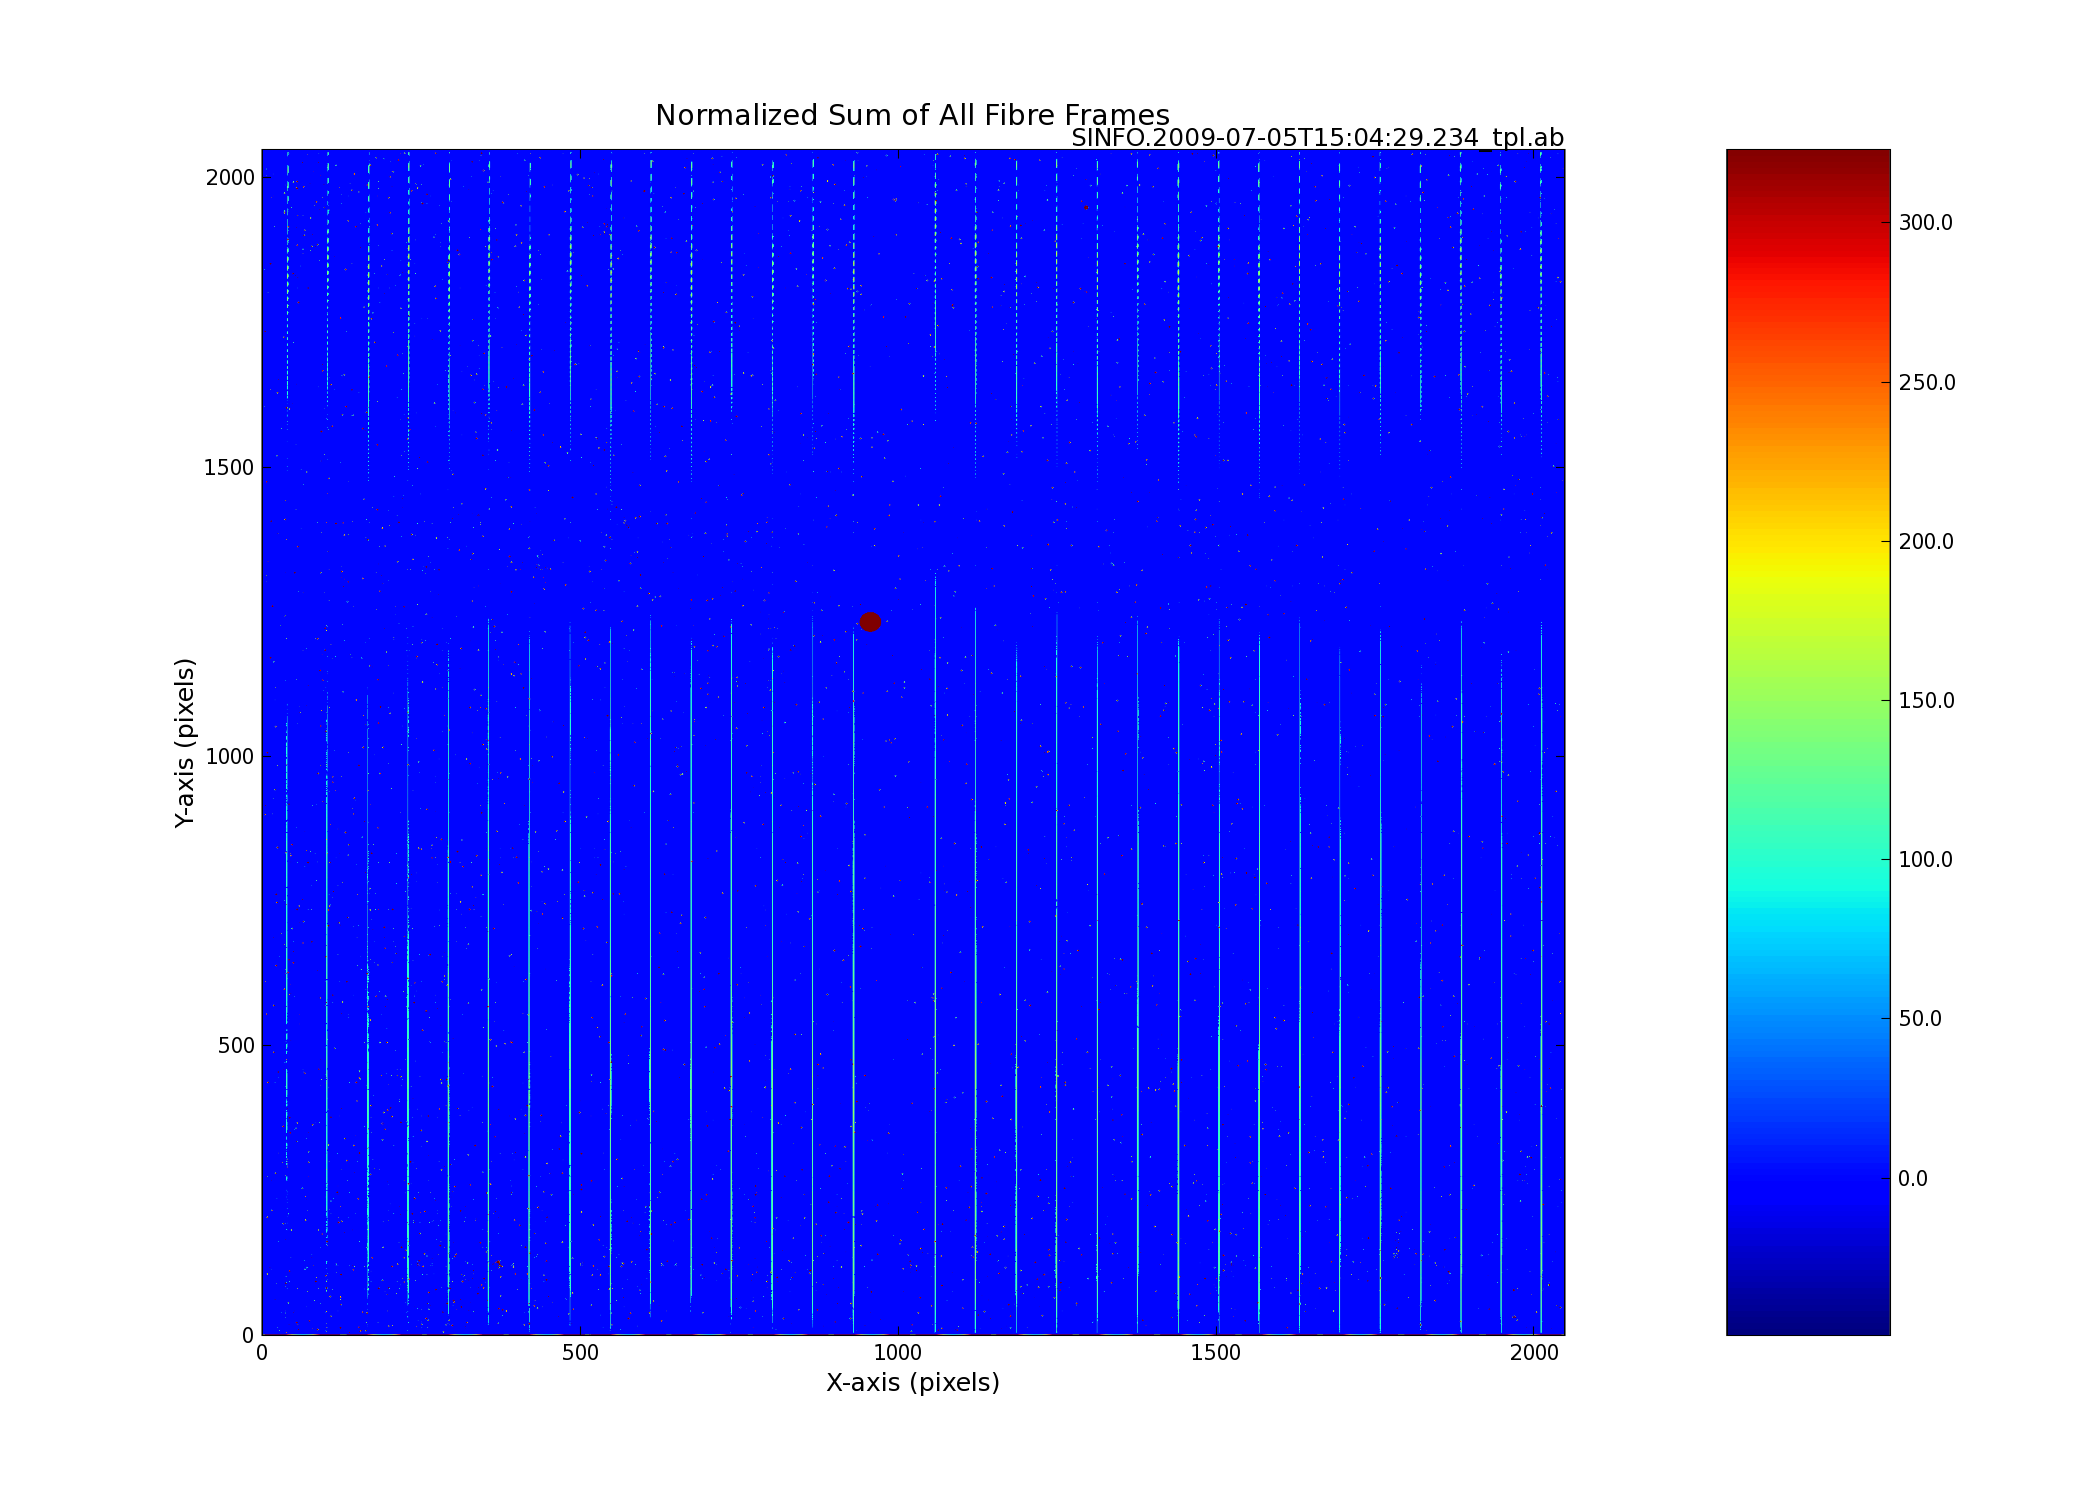
Failed distortions come in a number of flavours. Here is a representative sample showing the co-addition of all (~75) fibre frames (click to view the full size images):
For comparison, a usable, co-added, distortion should look like the following (click to view the full size image):
2006-07-25 (P77) The SINFONI pipeline corrects for optical distortion,
but differential refraction can cause spectrum shears in the final cube.
Although differential refraction is not important in the IR, with AO
it can become important again. For this reason differential refraction
is calculated according to Fillipenko1982, PASP 94, 715.
Table 1 is the repetition of the results of Fillipenko (1982). Table 2 contains the results for the 1-2.5 micron range, where the shifts
are given in arcsec with respect to 1.9 micron (the central wavelength
of the H+K grating that provides the largest wavelength range). In addition we give two trails of the peak position (x and y in pixel
along the wavelength) of telluric standard stars with setting 0.025
H+K.
2005-09-15 (P75) Since August 2005, there appear additional hot/cold
pixels in the area corresponding to slitlet #18. The additional hot/cold
pixels are aligned in columns. The number of hot/cold pixels is correlated
with DIT. Long-DIT darks show more hot/cold pixels than short-DIT darks.
The hot pixel are no longer visible in lamp flat frames. The detector
linearity products show, that the hot/cold pixels are independent on
flux (it is just an additional signal, the linearity of the pixel is
retained). The pattern varies in time, hence the hot/cold pixels cannot
be eliminated via dark frame subtraction.
2005-06-15 (P75) The transmission of SINFONI is not a constant
over the FOV. It varies up to 20%. There is a minimum for slitlets #8,
#9, and #10. Empty SKY frames have been pipeline processed as science
OBJECT frames (flat fielded, corrected for optical distortion ..., but
no sky subtraction) and cube reconstructed. The table shows the median
collapsed cubes. The sky emission lines serve as a spatially homogeneous
illumination source. The transmission as function of the FOV is not corrected
by the pipeline.
2005-06-02 (P75) Not a problem, but more a limitation: Science
products (PRO.CATG = COADD_OBJ) are only generated when the cross section
of the final coadded cube does not exceed a certain number of pixel.
The upper limit is at about 128 x 128. Mosaic is not supported by the
pipeline.
2005-05-23 (P75) The flat fields taken after 2005-04-01 show
a flux reduction in slitlet #32 of about 40% correlated with a partial
flux increase in slitlet #1 by 5-10%. Both slitlets build the lowermost
and uppermost slide in the FOV.
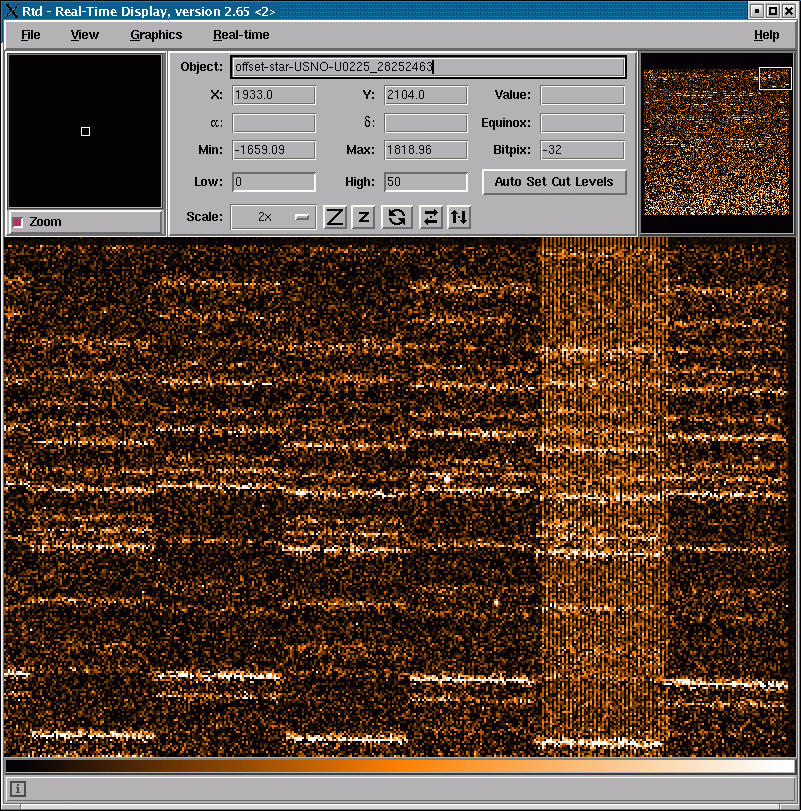
2005-05-23 (P75) On 2005-04-04, several telluric standard stars
saturated the chip. Hence a persistent signal occurred for about a week,
mostly detectable in long DIT (e.g 300sec, 600sec, 900sec) dark frames.
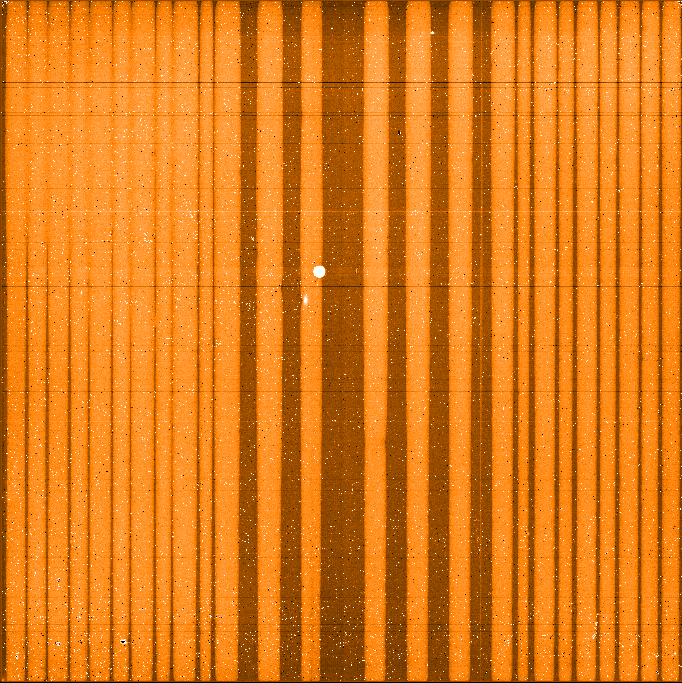
The persistence appears as several vertical stripes in all the raw frames,
most striking in high DIT frames. The stripes are partly flagged as hot
pixels in the hot pixel map. The largest gradient of fading occurred
in the first three days after this event. All science raw frames taken
up to 3-6 days after this event are more or less impact. The typical
excess in a DIT=600sec dark in ADU is
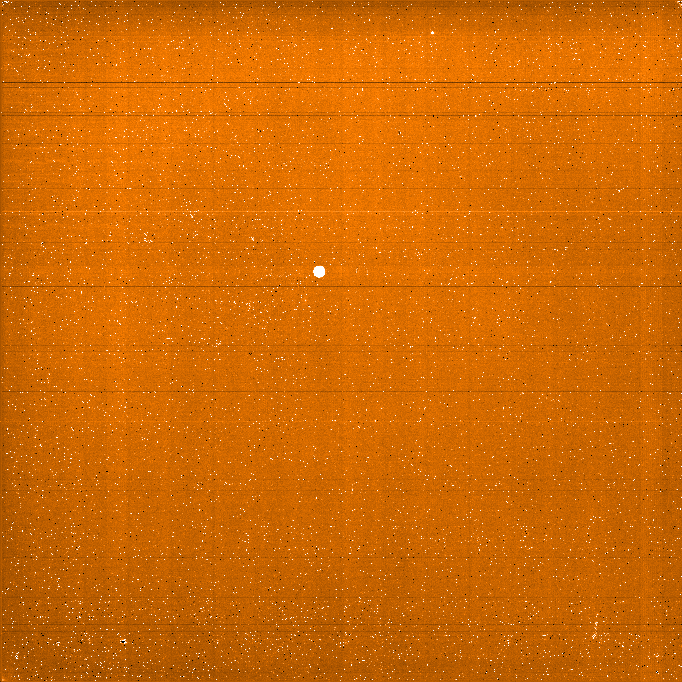
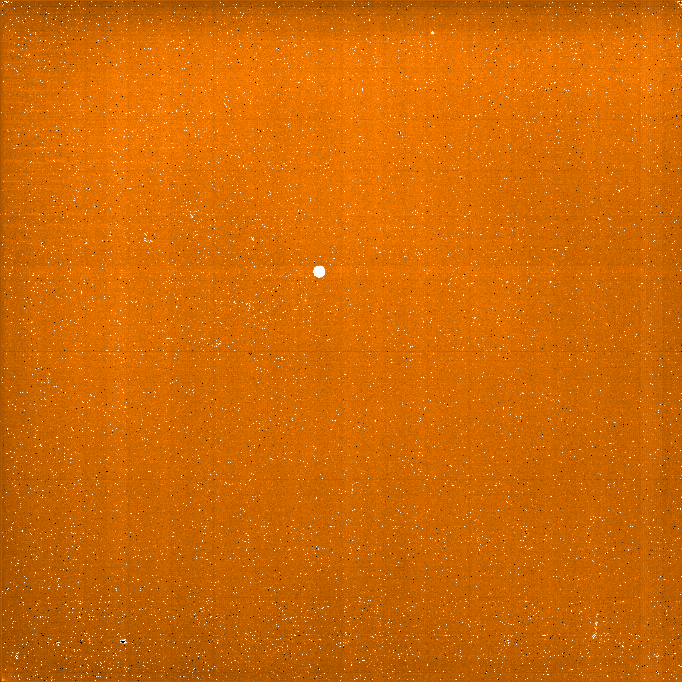
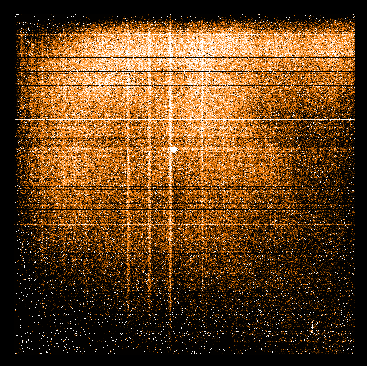
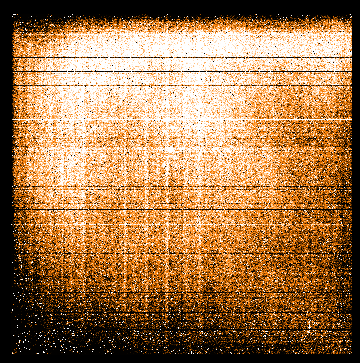
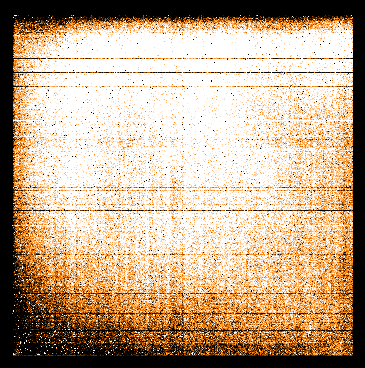
The following images demonstrate the temporal persistence of the array
using DARKs with DIT=600 sec (cuts=20..30):
2005-04-28 (P75) Science raw frames taken before 2005-03-30 have
been reduced using pipeline version 1.0. Reconstructed and coadded science
product cubes suffer of two inconsistencies. a) slitlet #1 of individual
cubes is not expanded from one spaxel to two pixel. b) the plane size
of the cube is fixed to 80 x 80 pixels, hence large offset stacks will
not fit completely in the fixed size cube (pipeline version 1.0.1).
2005-04-25 (P75) From science stacks without embedded SKY frames,
that are pointing to the clear sky (no source), we derived typical sky
subtraction residuals of about 60 ADU in the stacked product frames and
about 200 ADU in the coadded product frames for DIT=600 sec. These residuals
are due to sky emission line variations from exposure to exposure.
2005-04-25 (P75) The pipeline version 1.0.1 is used to reduce
stacks of science frames. The dark products are not part of the cascade.
Science data stacks with embedded SKY frames are well reduced. Science
stacks without embedded SKY frames are reduced using one of the three
offered reduction methods. We use a pair-wise subtraction of consecutive
OBJECT frames to eliminate the SKY, before co-adding. Hence science products
contain the negative spectra as well (similar to ISAAC LW chopping).
If the user-specified jitter offsets are less than or of the order of
the PSF, this method becomes critical.
2005-04-25 (P75) : The dark frames, with DIT>200 show in a
sporadic manner a few ADU higher signal of the even columns in the area
of slitlet #25, (~ column 1922 ... 1985). The same behavior has been
found for telluric standard star observations, psf calibrations and science
frames. As en electronic effect, it may occur in all kind of exposures
of the SINFONI array. The effect is monitored in DARK frames. Slitlet
#25 can therefore contaminated in a sporadic manner by this effect.
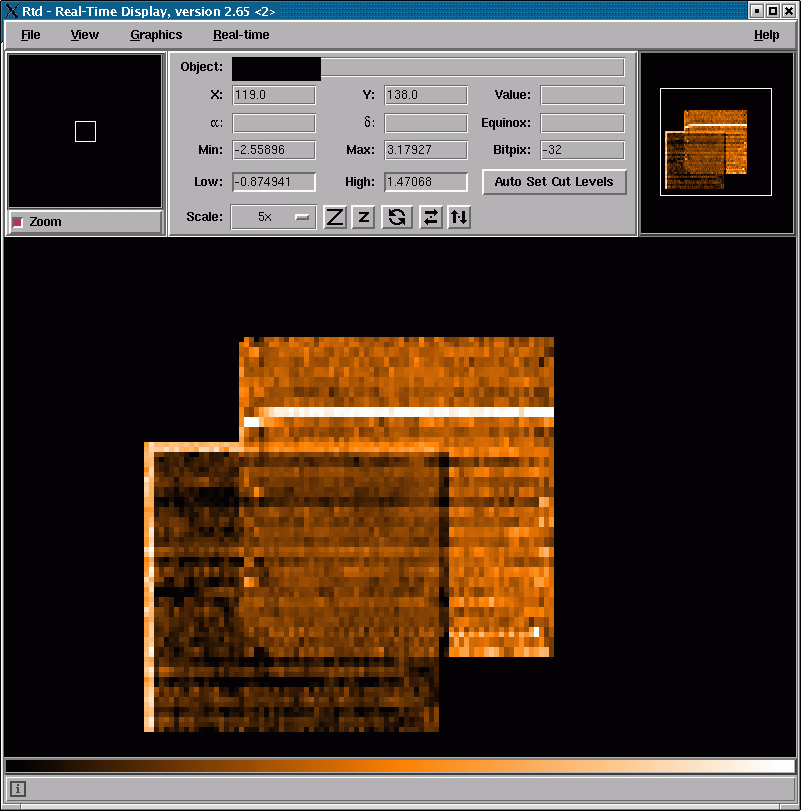
The following two images show the upper right part of two raw dark frames
(DIT=300 sec), once without and once with high signal effect 2005-03-13 (P75) : Start of operations |
|||||||||||||||||||||||||||||||||||||||||||||||||||||||||||||||||||||||||||||||||||||||||||||||||||||||||||||||||||||||||||||||||||||||||||||||||||||||||||||||||||||||||||||||||||||||||||||||||||||||||||||||||||||||||||