The P2VM (Pixel to Visibility Matrix) is used to calibrate the science data. The pipeline product provides also some QC parameters which are used to monitor the Instrumental transfer function and the offset between the photometric beams.
In Low resolution JHK, the Instrumental Visibility is calculated across the full JHK spectrum (plot P2VM_LJHK) or in the individual bands (J, H and K). The band K, H or J Instrumental Visibilities are shown in K_P2VM_LJHK, H_P2VM_LJHK, J_P2VM_LJH.
General information
Click on any of the plots to see a close-up version.
The latest date is indicated on top of the plot.
If configured,
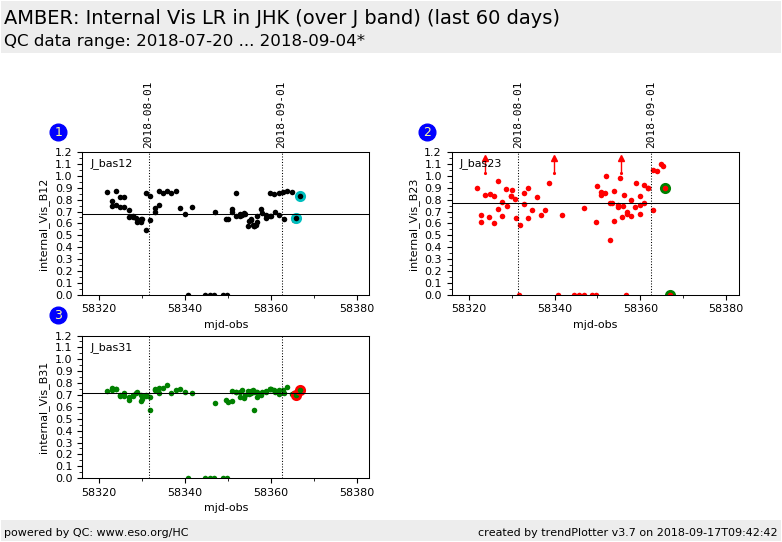
data points belonging to the latest date are specially marked
statistical averages are indicated by a solid line, and thresholds by broken lines
outliers are marked by a red asterisk. They are defined as data points outside the
threshold lines
"aliens" (= data points outside the plot Y limits) are marked by a red arrow (↑ or ↓)
you can download the data for each parameter set if the 'Data downloads' link shows up
