|
|
 |
| |
| QC
PLOTS |
| |
CURRENT |
HISTORY |
| effective non-linearity and maximum exposure level |
 |
 |
| QC1
database (advanced users): browse
| plot |
Click on CURRENT
to see the current trending (Health Check).
Click on HISTORY
to see the historical evolution of the trending. |
The CRIRES detector arrays become non-linear for exposure
levels above about 4000 ADUs. This behaviour is assessed by a series of
dark and flat exposures with increasing DIT which maps in the flats the
gain behaviour from the linear to the non-linear regime. After dark subtraction,
the function
ADU =
A + B * DIT + C * DIT^2
is fitted for each pixel of the flat sequence. The coefficients
A, B, and C are saved into an output cube, which can be converted into individual frames. Above about 12000 ADUs, a quadratic fit is not
sufficient any more. Such exposure levels should, therefore, be avoided.
The application of the coefficient images to correct science
frames is described on the science
recipe pages.
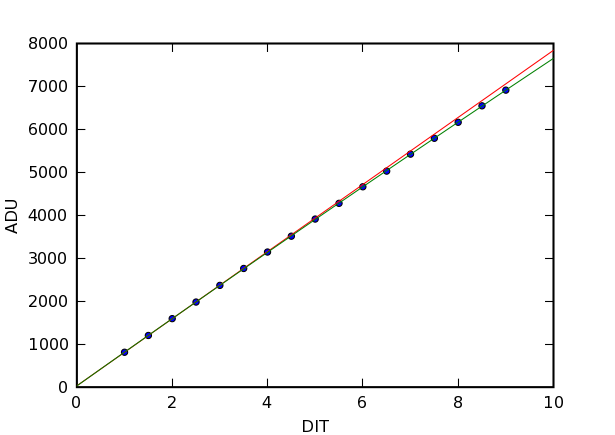 |
Example fit. A fit
of the increasing flux for a single pixel (x=511, y=256). The measured
values are plotted as blue circles. The red line is a linear fit
to the first two exposures; the green line a quadratic function
with A = 29, B = 787, and C = -2.5. Both fits begin to differ above
about 4000 ADU.
|
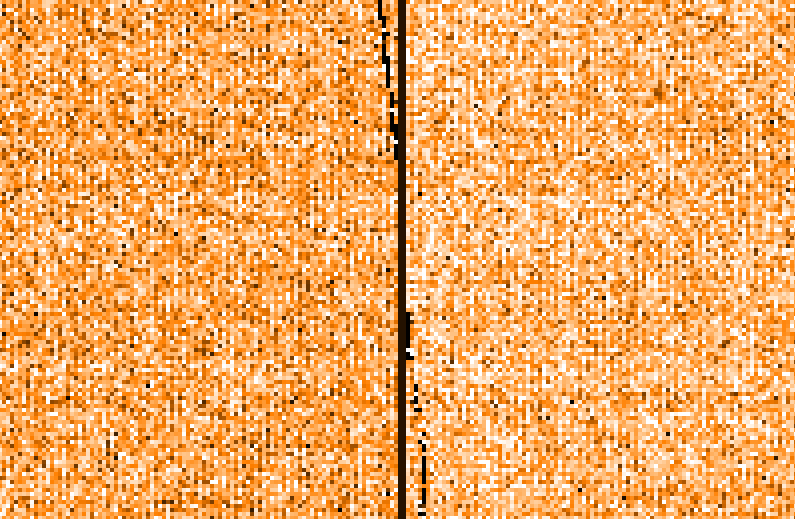 |
Example frame for A coefficients.
Enlargement of the centre region of an image of the A coefficients.
|
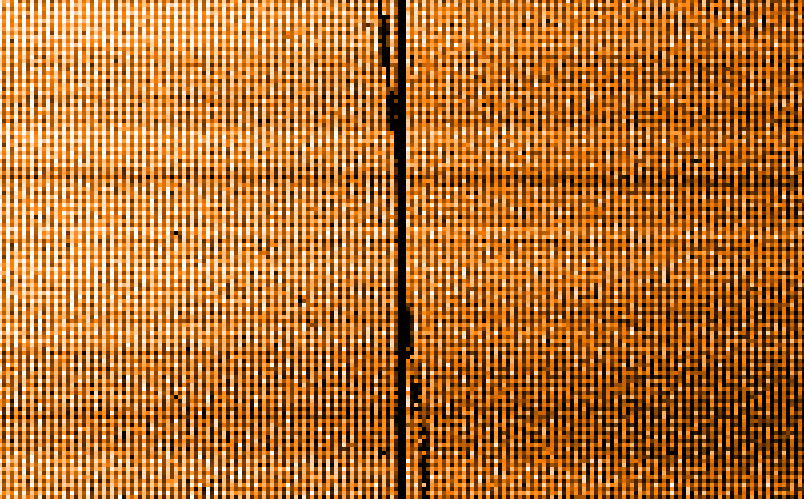 |
Example frame for B coefficients.
Enlargement of the centre region of an image of the B coefficients.
These coefficients show the pixel-to-pixel gain variation in the
linear regime which can be corrected by flat-fielding.
|
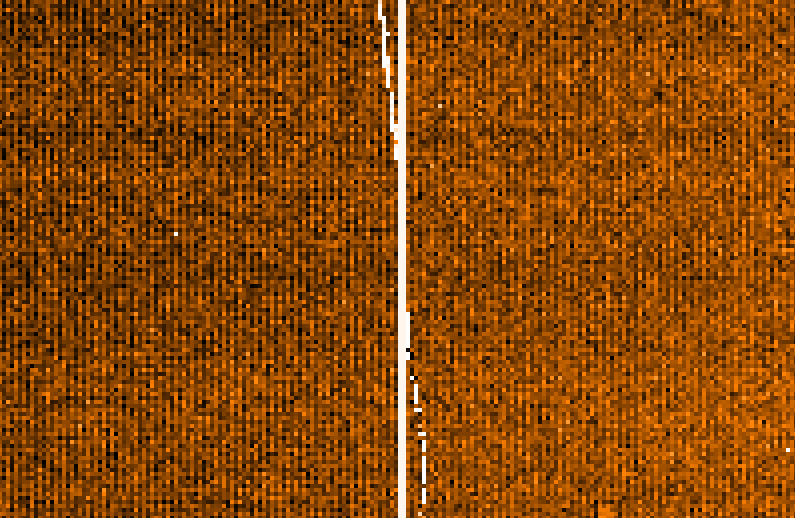 |
Example frame for C coefficients.
Enlargement of the centre region of an image of the C coefficients.
These are the remaining pixel-to-pixel gain variations in the non-linear
regime.
|
QC1 parameters
QC1 parameters for
CRIRES flat-field exposures are measured for each detector array separately.
| parameter |
QC1 database: table, name
|
procedure |
| mean effective non-linearity |
crires_detmon, lineff |
difference between the flux obtained at reference level from the polynomial fit and the flux predicted by the linear term only, normalized by the polynomial flux |
| reference level for lineff |
crires_detmon, reflevel |
none (user-defined) |
| maximum exposure level |
crires_detmon, counts_max |
mean exposure level of flat frame with highest DIT |
Trending
The effective non-linearity and the maximum exposure level are trended.
|
