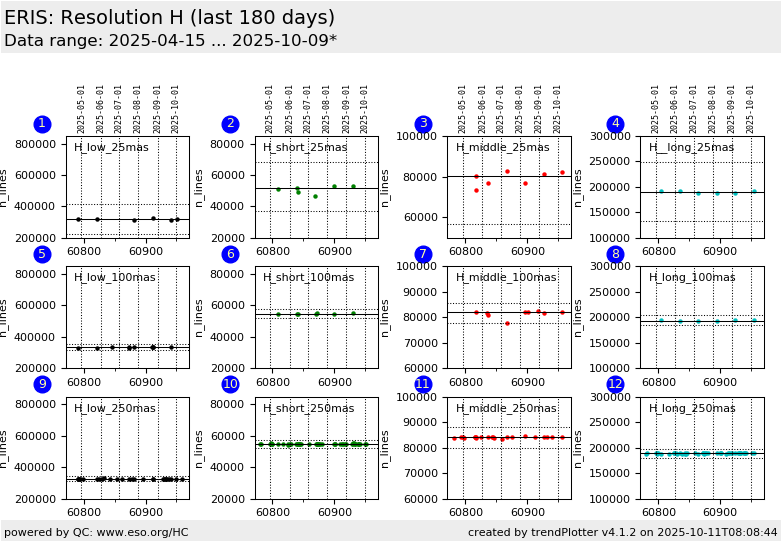
ERIS trending system: HEALTH CHECK report
Last update: 2026-01-09T19:04:40 (UT)
[enable javascript for displaying time difference!]
General news:
NOTE: The Health Check and calChecker services are moved to qcFlow on an instrument by instrument basis. The current pages will not be updated any longer once the move has been finished.
ERIS news:
Report news:
Plot? Symb? Source Average ? Thresholds ? N_ QC1 Data Remarks
method value unit method value
1
• QC1DB MEDIAN 3.19e+05 n_lines VAL 223000,413000 7 qc_wave_nfitlines
this |
last_yr |
all
n_lines: H_low 25mas
2
• QC1DB MEDIAN 5.27e+04 n_lines VAL 36900,68600 5 qc_wave_nfitlines
this |
last_yr |
all
n_lines: H_short 25mas&
3
• QC1DB MEDIAN 8.14e+04 n_lines VAL 56700,105200 5 qc_wave_nfitlines
this |
last_yr |
all
n_lines: H_middle 25mas
4
• QC1DB MEDIAN 1.88e+05 n_lines VAL 133000,248000 5 qc_wave_nfitlines
this |
last_yr |
all
n_lines: H_long 25mas
5
• QC1DB MEDIAN 3.35e+05 n_lines VAL 317400,350800 12 qc_wave_nfitlines
this |
last_yr |
all
n_lines: H_low 100mas
6
• QC1DB MEDIAN 5.48e+04 n_lines VAL 52040,57520 6 qc_wave_nfitlines
this |
last_yr |
all
n_lines: H_short 100mas&
7
• QC1DB MEDIAN 8.17e+04 n_lines VAL 77520,85670 9 qc_wave_nfitlines
this |
last_yr |
all
n_lines: H_middle 100mas
8
• QC1DB MEDIAN 1.94e+05 n_lines VAL 184600,204000 5 qc_wave_nfitlines
this |
last_yr |
all
n_lines: H_long 100mas
9
• QC1DB MEDIAN 3.25e+05 n_lines VAL 309400,342000 20 qc_wave_nfitlines
this |
last_yr |
all
n_lines: H_low 250mas
10
• QC1DB MEDIAN 5.48e+04 n_lines VAL 51950,57420 39 qc_wave_nfitlines
this |
last_yr |
all
n_lines: H_short 250mas&
11
• QC1DB MEDIAN 8.4e+04 n_lines VAL 79880,88280 11 qc_wave_nfitlines
this |
last_yr |
all
n_lines: H_middle 250mas
12
• QC1DB MEDIAN 1.89e+05 n_lines VAL 179200,198100 39 qc_wave_nfitlines
this |
last_yr |
all
n_lines: H_long 250mas
*Data sources: QC1DB: QC1 database; LOCAL: local data source
Plot 1 scores: 1 |
data source: eris_ifu_wave dataset: qc_wave_nfitlines • median: 3.19e+05 n_lines fixed thresholds: 223000...413000 n_lines N_data plotted: 7 [click plot for closeup]
Plot 2 scores: 1 |
data source: eris_ifu_wave dataset: qc_wave_nfitlines • median: 5.27e+04 n_lines fixed thresholds: 36900...68600 n_lines N_data plotted: 5 [click plot for closeup]
Plot 3 scores: 1 |
data source: eris_ifu_wave dataset: qc_wave_nfitlines • median: 8.14e+04 n_lines fixed thresholds: 56700...105200 n_lines N_data plotted: 5 [click plot for closeup]
Plot 4 scores: 1 |
data source: eris_ifu_wave dataset: qc_wave_nfitlines • median: 1.88e+05 n_lines fixed thresholds: 133000...248000 n_lines N_data plotted: 5 [click plot for closeup]
Plot 5 scores: 1 |
data source: eris_ifu_wave dataset: qc_wave_nfitlines • median: 3.35e+05 n_lines fixed thresholds: 317400...350800 n_lines N_data plotted: 12 [click plot for closeup]
Plot 6 scores: 1 |
data source: eris_ifu_wave dataset: qc_wave_nfitlines • median: 5.48e+04 n_lines fixed thresholds: 52040...57520 n_lines N_data plotted: 6 [click plot for closeup]
Plot 7 scores: 2 |
data source: eris_ifu_wave dataset: qc_wave_nfitlines • median: 8.17e+04 n_lines fixed thresholds: 77520...85670 n_lines N_data plotted: 9 [click plot for closeup]
Plot 8 scores: 1 |
data source: eris_ifu_wave dataset: qc_wave_nfitlines • median: 1.94e+05 n_lines fixed thresholds: 184600...204000 n_lines N_data plotted: 5 [click plot for closeup]
Plot 9 scores: 1 |
data source: eris_ifu_wave dataset: qc_wave_nfitlines • median: 3.25e+05 n_lines fixed thresholds: 309400...342000 n_lines N_data plotted: 20 [click plot for closeup]
Plot 10 scores: 1 |
data source: eris_ifu_wave dataset: qc_wave_nfitlines • median: 5.48e+04 n_lines fixed thresholds: 51950...57420 n_lines N_data plotted: 39 [click plot for closeup]
Plot 11 scores: 1 |
data source: eris_ifu_wave dataset: qc_wave_nfitlines • median: 8.4e+04 n_lines fixed thresholds: 79880...88280 n_lines N_data plotted: 11 [click plot for closeup]
Plot 12 scores: 1 |
data source: eris_ifu_wave dataset: qc_wave_nfitlines • median: 1.89e+05 n_lines fixed thresholds: 179200...198100 n_lines N_data plotted: 39 [click plot for closeup]
General information
Click on any of the plots to see a close-up version .
The latest date is indicated on top of the plot.
If configured,
data points belonging to the latest date are specially marked statistical averages are indicated by a solid line, and thresholds by broken lines outliers are marked by a red asterisk. They are defined as data points outside the
threshold lines "aliens" (= data points outside the plot Y limits) are marked by a red arrow (↑ ↓ you can download the data for each parameter set if the 'Data downloads' link shows up
