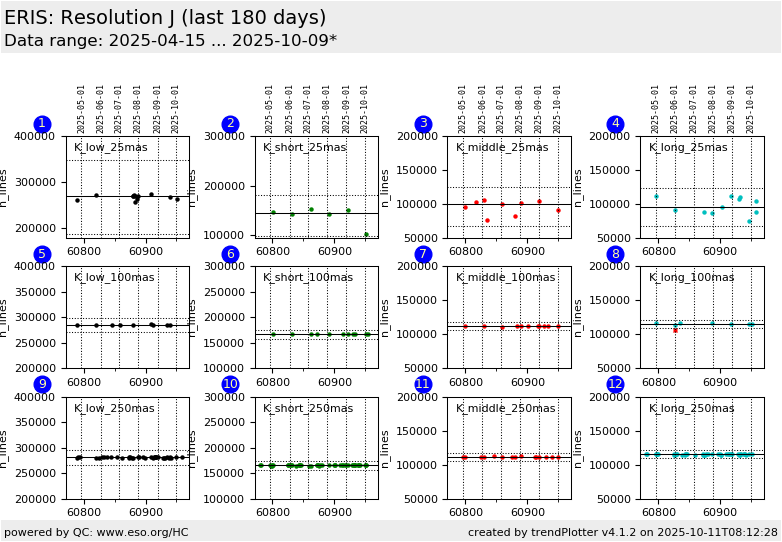
ERIS trending system: HEALTH CHECK report
Last update: 2026-01-09T19:05:15 (UT)
[enable javascript for displaying time difference!]
General news:
NOTE: The Health Check and calChecker services are moved to qcFlow on an instrument by instrument basis. The current pages will not be updated any longer once the move has been finished.
ERIS news:
Report news:
Plot? Symb? Source Average ? Thresholds ? N_ QC1 Data Remarks
method value unit method value
1
• QC1DB MEDIAN 2.68e+05 n_lines VAL 187000,347000 16 qc_wave_nfitlines
this |
last_yr |
all
n_lines: K_low 25mas
2
• QC1DB MEDIAN 1.43e+05 n_lines VAL 97500,181200 5 qc_wave_nfitlines
this |
last_yr |
all
n_lines: K_short 25mas&
3
• QC1DB MEDIAN 9.57e+04 n_lines VAL 67100,124600 13 qc_wave_nfitlines
this |
last_yr |
all
n_lines: K_middle 25mas
4
• QC1DB MEDIAN 9.67e+04 n_lines VAL 66700,123800 19 qc_wave_nfitlines
this |
last_yr |
all
n_lines: K_long 25mas
5
• QC1DB MEDIAN 2.85e+05 n_lines VAL 270000,298400 10 qc_wave_nfitlines
this |
last_yr |
all
n_lines: K_low 100mas
6
• QC1DB MEDIAN 1.67e+05 n_lines VAL 158000,174600 15 qc_wave_nfitlines
this |
last_yr |
all
n_lines: K_short 100mas&
7
• QC1DB MEDIAN 1.12e+05 n_lines VAL 106300,117500 16 qc_wave_nfitlines
this |
last_yr |
all
n_lines: K_middle 100mas
8
• QC1DB MEDIAN 1.16e+05 n_lines VAL 109700,121300 12 qc_wave_nfitlines
this |
last_yr |
all
n_lines: K_long 100mas
9
• QC1DB MEDIAN 2.81e+05 n_lines VAL 266500,294600 34 qc_wave_nfitlines
this |
last_yr |
all
n_lines: K_low 250mas
10
• QC1DB MEDIAN 1.65e+05 n_lines VAL 157000,173500 40 qc_wave_nfitlines
this |
last_yr |
all
n_lines: K_short 250mas&
11
• QC1DB MEDIAN 1.12e+05 n_lines VAL 105900,117100 16 qc_wave_nfitlines
this |
last_yr |
all
n_lines: K_middle 250mas
12
• QC1DB MEDIAN 1.15e+05 n_lines VAL 109500,121000 42 qc_wave_nfitlines
this |
last_yr |
all
n_lines: K_long 250mas
*Data sources: QC1DB: QC1 database; LOCAL: local data source
Plot 1 scores: 2 |
data source: eris_ifu_wave dataset: qc_wave_nfitlines • median: 2.68e+05 n_lines fixed thresholds: 187000...347000 n_lines N_data plotted: 16 [click plot for closeup]
Plot 2 scores: 1 |
data source: eris_ifu_wave dataset: qc_wave_nfitlines • median: 1.43e+05 n_lines fixed thresholds: 97500...181200 n_lines N_data plotted: 5 [click plot for closeup]
Plot 3 scores: 2 |
data source: eris_ifu_wave dataset: qc_wave_nfitlines • median: 9.57e+04 n_lines fixed thresholds: 67100...124600 n_lines N_data plotted: 13 [click plot for closeup]
Plot 4 scores: 2 |
data source: eris_ifu_wave dataset: qc_wave_nfitlines • median: 9.67e+04 n_lines fixed thresholds: 66700...123800 n_lines N_data plotted: 19 [click plot for closeup]
Plot 5 scores: 1 |
data source: eris_ifu_wave dataset: qc_wave_nfitlines • median: 2.85e+05 n_lines fixed thresholds: 270000...298400 n_lines N_data plotted: 10 [click plot for closeup]
Plot 6 scores: 5 |
data source: eris_ifu_wave dataset: qc_wave_nfitlines • median: 1.67e+05 n_lines fixed thresholds: 158000...174600 n_lines N_data plotted: 15 [click plot for closeup]
Plot 7 scores: 2 |
data source: eris_ifu_wave dataset: qc_wave_nfitlines • median: 1.12e+05 n_lines fixed thresholds: 106300...117500 n_lines N_data plotted: 16 [click plot for closeup]
Plot 8 scores: 1 |
data source: eris_ifu_wave dataset: qc_wave_nfitlines • median: 1.16e+05 n_lines fixed thresholds: 109700...121300 n_lines N_data plotted: 12 [click plot for closeup]
Plot 9 scores: 1 |
data source: eris_ifu_wave dataset: qc_wave_nfitlines • median: 2.81e+05 n_lines fixed thresholds: 266500...294600 n_lines N_data plotted: 34 [click plot for closeup]
Plot 10 scores: 1 |
data source: eris_ifu_wave dataset: qc_wave_nfitlines • median: 1.65e+05 n_lines fixed thresholds: 157000...173500 n_lines N_data plotted: 40 [click plot for closeup]
Plot 11 scores: 2 |
data source: eris_ifu_wave dataset: qc_wave_nfitlines • median: 1.12e+05 n_lines fixed thresholds: 105900...117100 n_lines N_data plotted: 16 [click plot for closeup]
Plot 12 scores: 2 |
data source: eris_ifu_wave dataset: qc_wave_nfitlines • median: 1.15e+05 n_lines fixed thresholds: 109500...121000 n_lines N_data plotted: 42 [click plot for closeup]
General information
Click on any of the plots to see a close-up version .
The latest date is indicated on top of the plot.
If configured,
data points belonging to the latest date are specially marked statistical averages are indicated by a solid line, and thresholds by broken lines outliers are marked by a red asterisk. They are defined as data points outside the
threshold lines "aliens" (= data points outside the plot Y limits) are marked by a red arrow (↑ ↓ you can download the data for each parameter set if the 'Data downloads' link shows up
