Plot
? |
Symb
? |
Source
* |
Average ? |
Thresholds ? |
N_
data |
QC1
parameter |
Data
downloads |
Remarks |
| method |
value |
unit |
method |
value |
| 1 |
• | QC1DB |
none |
|
NONE |
none | |
488 |
fiba_resol_med |
all (full time range)
| resolving power R, fibre A, 1x1 binning |
| 3 |
• | QC1DB |
none |
|
NONE |
none | |
589 |
fibb_resol_med |
all (full time range)
| resolving power R, fibre B, 1x1 binning |
| |
|
*Data sources: QC1DB: QC1 database; LOCAL: local data source
|
| Plot 1 | | data source: | espresso_wave_thar_a
(QC1 database) |
| dataset: | fiba_resol_med | • |
| average: | none |
| thresholds: | none |
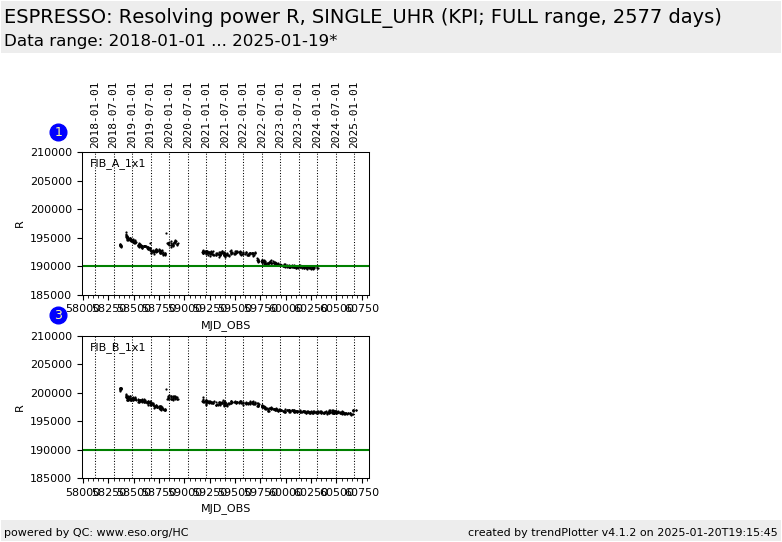
| N_data plotted: | 488 |
| (current) reference: | 190000 |
| [click plot for closeup] |
| Plot 3 | | data source: | espresso_wave_thar_b
(QC1 database) |
| dataset: | fibb_resol_med | • |
| average: | none |
| thresholds: | none |
| N_data plotted: | 589 |
| (current) reference: | 190000 |
| [click plot for closeup] |
KPI plot for spectral resolving power R as measured with Th-Ar arc lines.
The KPI reference values are based on measurements during commissioning in 2018
as reported in the User Manual v1.3. They are R = 190000, 14000, and 70000 for
UHR, HR, and MR, respectively.
General information
Click on any of the plots to see a close-up version.
The latest date is indicated on top of the plot.
If configured,
- data points belonging to the latest date are specially marked
- statistical averages are indicated by a solid line, and thresholds by broken lines
- outliers are marked by a red asterisk. They are defined as data points outside the
threshold lines
- "aliens" (= data points outside the plot Y limits) are marked by a red arrow (↑ or ↓)
- you can download the data for each parameter set if the 'Data downloads' link shows up
|
