Plot
? |
Symb
? |
Source
* |
Average ? |
Thresholds ? |
N_
data |
QC1
parameter |
Data
downloads |
Remarks |
| method |
value |
unit |
method |
value |
| 1 |
• | QC1DB |
none |
|
NONE |
VAL | 170,170 |
90 |
fiba_order_nb |
this |
last_yr |
all
|
total number of found orders, fibre A |
| 2 |
• | QC1DB |
MEDIAN |
4.68e+03 |
px |
VAL | 4682.67,4683.07 |
90 |
fiba_centorder_pos |
this |
last_yr |
all
|
y position of central order, fibre A, BLUE detector |
| 3 |
• | QC1DB |
MEDIAN |
4.47e+03 |
px |
VAL | 4471.79,4472.19 |
90 |
fiba_centorder_pos |
this |
last_yr |
all
|
y position of central order, fibre A, RED detector |
| 4 |
• | QC1DB |
none |
|
NONE |
VAL | 170,170 |
90 |
fibb_order_nb |
this |
last_yr |
all
|
total number of found orders, fibre B |
| 5 |
• | QC1DB |
MEDIAN |
4.75e+03 |
px |
VAL | 4751.28,4751.68 |
90 |
fibb_centorder_pos |
this |
last_yr |
all
|
y position of central order, fibre B, BLUE detector |
| 6 |
• | QC1DB |
MEDIAN |
4.54e+03 |
px |
VAL | 4541.91,4542.31 |
90 |
fibb_centorder_pos |
this |
last_yr |
all
|
y position of central order, fibre B, RED detector |
| |
|
*Data sources: QC1DB: QC1 database; LOCAL: local data source
|
Plot 1
scores:  8| 8|
| | data source: | espresso_orderdef
(QC1 database) |
| dataset: | fiba_order_nb | • |
| average: | none |
| fixed thresholds: | 170...170 | NONE |
| N_data plotted: | 90 |
| [click plot for closeup] |
Plot 2
scores: 8|
| | data source: | espresso_orderdef
(QC1 database) |
| dataset: | fiba_centorder_pos | • |
| median: | 4.68e+03 | px |
| fixed thresholds: | 4682.67...4683.07 | px |
| N_data plotted: | 90 |
| [click plot for closeup] |
Plot 3
scores: 8|
| | data source: | espresso_orderdef
(QC1 database) |
| dataset: | fiba_centorder_pos | • |
| median: | 4.47e+03 | px |
| fixed thresholds: | 4471.79...4472.19 | px |
| N_data plotted: | 90 |
| [click plot for closeup] |
Plot 4
scores: 8|
| | data source: | espresso_orderdef
(QC1 database) |
| dataset: | fibb_order_nb | • |
| average: | none |
| fixed thresholds: | 170...170 | NONE |
| N_data plotted: | 90 |
| [click plot for closeup] |
Plot 5
scores: 8|
| | data source: | espresso_orderdef
(QC1 database) |
| dataset: | fibb_centorder_pos | • |
| median: | 4.75e+03 | px |
| fixed thresholds: | 4751.28...4751.68 | px |
| N_data plotted: | 90 |
| [click plot for closeup] |
Plot 6
scores: 8|
| | data source: | espresso_orderdef
(QC1 database) |
| dataset: | fibb_centorder_pos | • |
| median: | 4.54e+03 | px |
| fixed thresholds: | 4541.91...4542.31 | px |
| N_data plotted: | 90 |
| [click plot for closeup] |
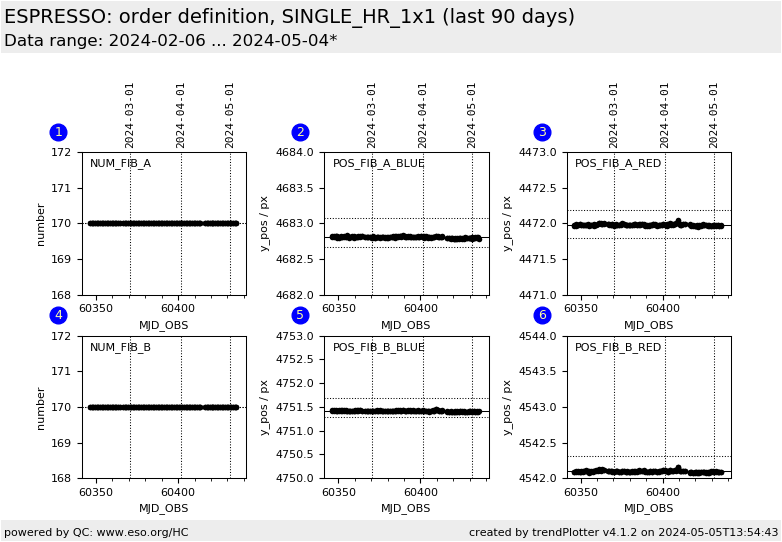
Trending plot for order-definition calibrations.
This plot shows the total number of found orders and the y position of two
dedicated orders on the detector.
For the HR and UHR modes, the pipeline recipe should identify 170 orders in
total, 90 on the BLUE chip and 80 on the RED chip. This number is trended
separately for fibres A and B.
For trending the order position on the detector, a central order number has been
chosen. The y position of this order is trended separately for the BLUE and
the RED chip and for fibres A and B.
General information
Click on any of the plots to see a close-up version.
The latest date is indicated on top of the plot.
If configured,
- data points belonging to the latest date are specially marked
- statistical averages are indicated by a solid line, and thresholds by broken lines
- outliers are marked by a red asterisk. They are defined as data points outside the
threshold lines
- "aliens" (= data points outside the plot Y limits) are marked by a red arrow (↑ or ↓)
- you can download the data for each parameter set if the 'Data downloads' link shows up
|