Health Check monitor


Agora | CAL | HC | refs | QC
HealthCheck Monitor
    HOME | UsersGuide
FORS1:
zeropoints: night
Other HC:
QC links:
FORS1 trending system: HEALTH CHECK plot
Last update: 2008-11-20T23:50:27 (UT)
now: 2008-11-21T00:04:22 (UT)
scores active INFO USERS-GUIDE MORE
same group: U_BESS B_BESS V_BESS R_BESS I_BESS u_HIGH b_HIGH v_HIGH g_HIGH
no OPSLOG data
space
Plot:
N_data:
history ... | plot tutorial ... [info]
Print: Information and research: News:
- png file - advanced studies: QC1 browser | QC1 plotter
2008-11-06 Photometric coefficients have been updated in the pipeline.
Plot
?
Symb
?
Source
*
OPS?
**
Average ? Thresholds ? N_
data
QC1
parameter
Data
downloads
Remarks
method value unit method value
1 QC1DB   none   mag none   28 zeropoint this | last_yr | all Night zeropoint from e-/sec (more than 1 star; Garching)
1 QC1DB   none   mag none   2 zeropoint this | last_yr | all Night zeropoint from e-/sec (1 star only; Garching)
1 QC1DB   MEDIAN 26.984 mag 3SIG± 0.06072 22 zeropoint this | last_yr | all Night zeropoint from e-/sec (photometric nights only; Garching)
2 QC1DB   MEDIAN 0.015 mag 3SIG± 0.03462 30 sigma_zeropoint this | last_yr | all error of night zeropoint from e-/sec (Garching)
3 QC1DB   none   mag none   20 zeropoint this | last_yr | all Night zeropoint from e-/sec (more than 1 star; Garching)
3 QC1DB   none   mag none   1 zeropoint this | last_yr | all Night zeropoint from e-/sec (1 star only; Garching)
3 QC1DB   MEDIAN 26.936 mag 3SIG± 0.06699 15 zeropoint this | last_yr | all Night zeropoint from e-/sec (photometric nights only; Garching)
4 QC1DB   MEDIAN 0.024 mag 3SIG± 0.03458 21 sigma_zeropoint this | last_yr | all error of night zeropoint from e-/sec (Garching)
*Data sources: QC1DB: QC1 database; LOCAL: local text file | **OPS: to indicate that OPSLOG data are included
This plot

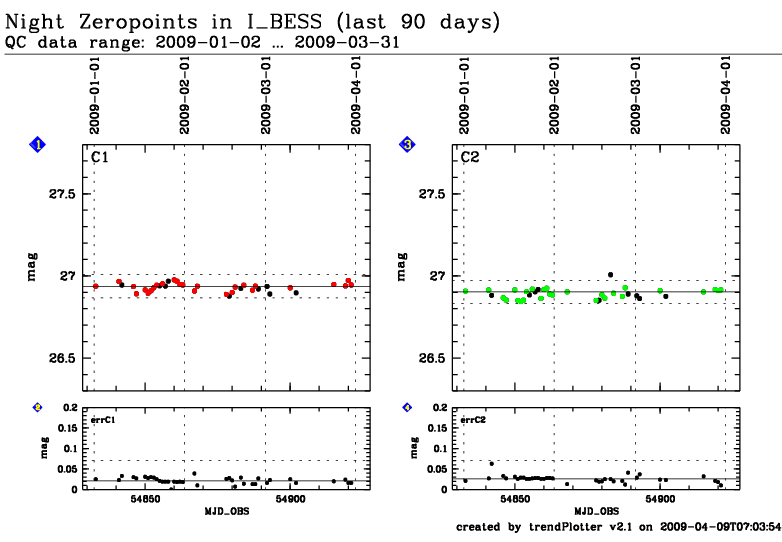
Trending is done only for the SR collimator. Photometric nights are selected from the Absorption Monitor. Zeropoints are per night for flux in e-/sec, not in ADU. Do not use these zeropoints for science data. They are reduced assuming a standard extinction value, which may not be correct for an individual night!  


General information

Click on any of the plots to see a close-up version. The latest date is indicated on top of the plot, data points belonging to that date are specially marked.

If configured,

  • statistical averages are indicated by a solid line, and thresholds by broken lines
  • outliers are marked by a red asterisk. They are defined as data points outside the threshold lines
  • "aliens" (= data points outside the plot Y limits) are marked by a red arrow ( or )
  • you can download the data for each parameter set if the 'Data downloads' link shows up