Quality Control and
Data Processing
|
GIRAFFE: Science recipe giscience
DPR CATG = SCIENCE, DPR TYPE = OBJECT,OzPoz or OBJECT,SimCal
 Recipe giscience
The pipeline recipe giscience performs the full reduction of GIRAFFE science frames. The following steps are performed:
1. old CCD (up to 2008-03-13): de-bias with a scaled master bias
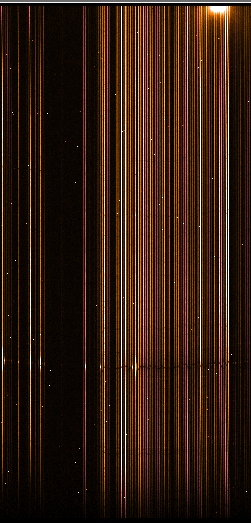
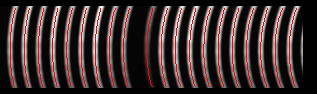
(--bsremove-method=ZMASTER); 2. remove background as defined by a master dark scaled by exposure time (old CCD only); 3. find and extract the fibres, using the localization and width solutions from the flat field; 4. divide the extracted science spectrum by extracted and normalized flat field; 5. correct science spectra for differences in the fibre transmission (as recorded in the flat field); 6. wavelength-calibrate and resample science spectrum, using the dispersion solution; 7. if SimCal is used, the wavelength scale is differentially corrected. Extraction. The fibre signal is extracted by summing up (average extraction) the signal based on the localization solution of the flat field (PLOC file, pro.catg = FF_LOCCENTROID). Note: the signal from the last one or two fibres does usually not fall completely onto the chip. The pipeline suppresses these fibres completely.
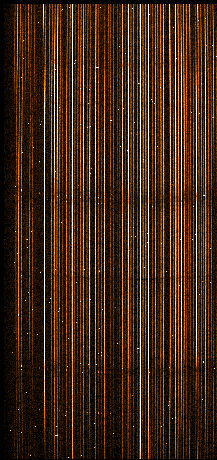
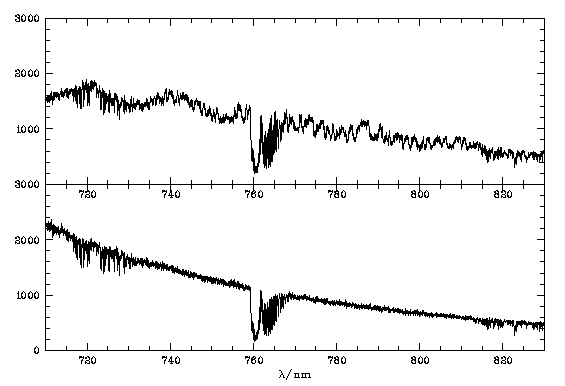
The pipeline offers two extraction methods: optimum extraction and average extraction. Science data processed by the QC group always use the average extraction. That extraction mode is numerically stable while the optimal mode has issues under certain circumstances. Flat-fielding. The extracted spectra are divided by the corresponding spectra of the flat field (PFEX file, pro.catg = FF_EXTSPECTRA). The flat-field signal is normalized such that the collapsed spectrum of the object fibre with the highest transmission is set to 1, and all other object fibres are scaled relative to that fibre signal. SIMCAL fibres in the flat-field are excluded from the statistics and always set to 1, while the SKY fibres get scaled like the object fibres. The extracted spectrum has the instrument response curve removed (at the price of now being affected by the lamp continuum which is however very smooth), and to a large extent also the fringing. The figure below demonstrates the effect of flattening: the 20nm scale ondulations are caused by the instrument response, while the ripples on the 1-2 nm scale are due to fringing. Both effects have disappeared after flattening.
Response. There is no response correction done by the pipeline. In Medusa mode, no standard stars are taken, in IFU mode only on request of the user. In Argus mode, spectrophotometric standard stars are measured routinely. They can be used to derive an approximate flux calibration, using the fibres with the STD signal to derive the response curve, while the transmission scaling of the other fibres is provided by the flat field data. Transmission. The fibre-to-fibre response differences are corrected using information from the fibre flats (the normalized factors from the above section "Flat-fielding"). Their values are stored as column TRANSMISSION in the fibre_setup table (extension 2 of the product files) and can be used to undo the correction if desired. Sky correction. The sky signal is recorded in the dedicated SKY fibres in the IFU and Argus modes. In Medusa mode, the user is completely free to record the sky signal in any object fibre. The sky signal is extracted by the recipe just as for any other fibre, and the final choice of the sky fibre is left to the user, if more than one has been taken. SimCal fibre correction. If the simultaneous calibration fibres have been used, their signal is used to incrementally correct the wavelength scale. The amount of the correction is available as column WLRES in the fibre_setup table (extension 2 of the product files) and can be used to undo the correction. The SimCal science data products also have information provided (in their product binary table) about barycentric, heliocentric and geocentric RV corrections (in km/s) per fibre. These corrections have not been applied by the pipeline. Products. The following main science products are created by the pipeline (there are more possible products, please check the pipeline manual):
* HIERARCH.ESO.PRO.CATG The error files (PRO.CATG = SCIENCE_RBNERRORS etc.) contain the calculated standard deviation per pixel of the SCIENCE_RBNSPECTRA file (containing: photon noise, read noise; flat-field extraction errors). Data format. The pipeline products come as FITS files with the product pixels in the first extension, and a binary table in the second extension. That fibre_setup table is described here. If downloaded from the phase3 archive, the GIRAFFE Medusa data products come as binary table. Find more information in the release description. The recipe can be run with the REFLEX workflow in a fine-tuned, interactive way, optimized for the science case. A standard reduction of all Medusa science data is provided by the QC group. These data are available through the phase3 archive interface.
|
||||||||||||||||||||||||||||||||||||||||||||||||||||||||||||||||||||||||||||||||||||||||||||||||||||||||||||||||||||||||||||||||||||||||||||||||||||||||||||||||||||||||||||||||||||||
| |
|||||||||||||||||||||||||||||||||||||||||||||||||||||||||||||||||||||||||||||||||||||||||||||||||||||||||||||||||||||||||||||||||||||||||||||||||||||||||||||||||||||||||||||||||||||||
 |
|
||||||||||||||||||||||||||||||||||||||||||||||||||||||||||||||||||||||||||||||||||||||||||||||||||||||||||||||||||||||||||||||||||||||||||||||||||||||||||||||||||||||||||||||||||||||