| GIRAFFE trending system: HISTORY plot | |||||||||||||||||||||||||||||||||||||||||||||||||||||||||||||||||||||||||||||||||||||||||||
| Last update: 2009-01-14T15:16:26 (UT) | |||||||||||||||||||||||||||||||||||||||||||||||||||||||||||||||||||||||||||||||||||||||||||
|
|||||||||||||||||||||||||||||||||||||||||||||||||||||||||||||||||||||||||||||||||||||||||||
|
|||||||||||||||||||||||||||||||||||||||||||||||||||||||||||||||||||||||||||||||||||||||||||

|
|||||||||||||||||||||||||||||||||||||||||||||||||||||||||||||||||||||||||||||||||||||||||||
|
|||||||||||||||||||||||||||||||||||||||||||||||||||||||||||||||||||||||||||||||||||||||||||
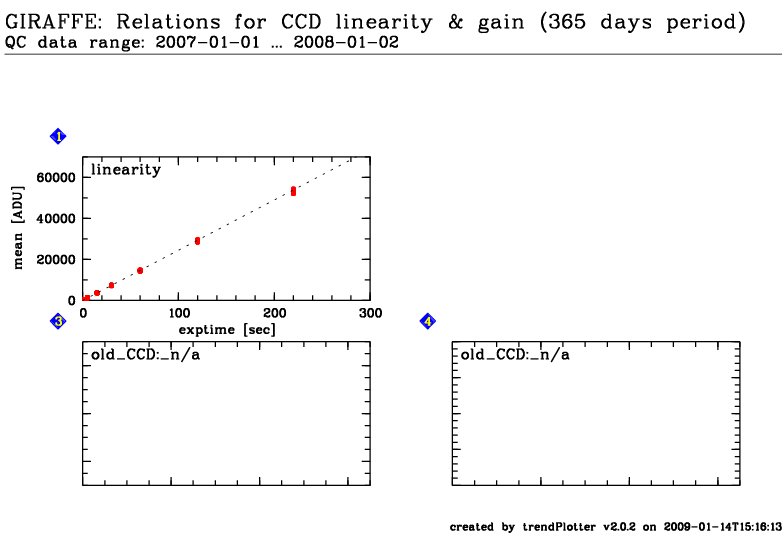
This report hosts correlation plots for the monitoring of the GIRAFFE linearity and gain, derived from image flats. These data are taken about monthly. Since 2008-07, they are acquired with the common detector monitoring template and reduced with the corresponding common recipe. Note the CCD upgrade between 2008-03 and 2008-05. Plots #3 and 4 are available for the new CCD only. A sequence of image flats is exposed between 0.5 and 220 secs. Their average exposure level is plotted against the exposure time (box 1). The fitted function corresponds to mean = 245*exptime for the old CCD, and 195*exptime for the new CCD. In box 3, non-linear residuals are plotted vs. exposure time (new CCD only). PLot 4 (for the new CCD only) shows the GAIN values plotted over exposure time. The asymptotic value for texp -> 0 is the true GAIN. The value stored in the file headers is indicated as "nominal".
Find the trending of non-linearity coefficient and gain here.
Click on any of the plots to see a close-up version.
The latest date is indicated on top of the plot, data points belonging to that date are specially marked. If configured, |
|||||||||||||||||||||||||||||||||||||||||||||||||||||||||||||||||||||||||||||||||||||||||||