| GIRAFFE trending system: HISTORY plot | |||||||||||||||||||||||||||||||||||||||||||||||||||||||||||||||||||||||||||||||
| Last update: 2009-01-15T17:01:08 (UT) | |||||||||||||||||||||||||||||||||||||||||||||||||||||||||||||||||||||||||||||||
|
|||||||||||||||||||||||||||||||||||||||||||||||||||||||||||||||||||||||||||||||
|
|||||||||||||||||||||||||||||||||||||||||||||||||||||||||||||||||||||||||||||||

|
|||||||||||||||||||||||||||||||||||||||||||||||||||||||||||||||||||||||||||||||
|
|||||||||||||||||||||||||||||||||||||||||||||||||||||||||||||||||||||||||||||||
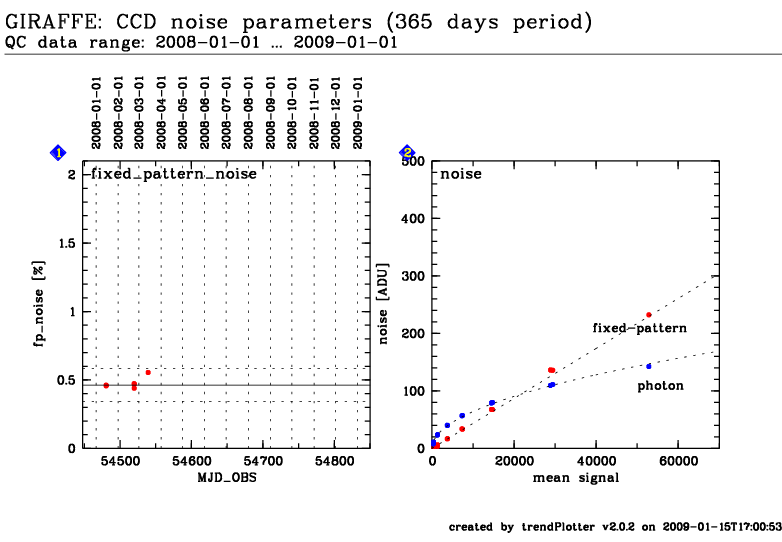
This is the trending plot for the monitoring of the GIRAFFE detector noise parameters, derived from image flats. Data for the old CCD (used until 2008-03) are complete. Due to issues with the pipeline recipe for detector monitoring, data for the new CCD have been calculated only since 2009-10. These frames are taken approximately once per month, as a sequence with exposure time increasing from 0.5 sec to 220 sec. For each value, a set of 2 image flats is taken, just exposing the CCD without the fibre system. For each pair, the difference frame is calculated from which the photon noise is determined. Then a raw frame is taken, shifted by one pixel in X and Y, and subtracted, in order to randomize the fixed-pattern noise. Finally the measured total noise and the photon noise are subtracted and give the fixed-pattern noise. It is trended as fraction of the mean signal in plot no. 1. The second plot displays the whole sequence of image flats, with the measured photon noise on a square-root curve, and the fixed-pattern noise on a linear curve. The intersection of both fits marks the transition from the photon-noise to the fixed-pattern noise regime. Find more information about GIRAFFE image flats frames here.
Other QC parameters related to detector properties (like dark,
linearity, gain) are trended in the same group.
Click on any of the plots to see a close-up version.
The latest date is indicated on top of the plot, data points belonging to that date are specially marked. If configured, |
|||||||||||||||||||||||||||||||||||||||||||||||||||||||||||||||||||||||||||||||