Plot
? |
Symb
? |
Source
* |
Average ? |
Thresholds ? |
N_
data |
QC1
parameter |
Data
downloads |
Remarks |
| method |
value |
unit |
method |
value |
| 1 |
• | QC1DB |
MEDIAN |
0.504 |
counts/sec |
VAL | 0.30,0.5 |
25 |
lamp_effic |
this |
last_yr |
all
|
ARCLAMP efficiency; H525.8B, Medusa1 |
| 2 |
x | QC1DB |
MEDIAN |
0.504 |
counts/sec |
VAL | 0.30,0.5 |
25 |
lamp_effic |
this |
last_yr |
all
|
as plot 1, Medusa2 |
| 3 |
∗ | QC1DB |
MEDIAN |
0.109 |
counts/sec |
VAL | 0.06,0.10 |
13 |
lamp_effic |
this |
last_yr |
all
|
as plot 1, IFU1 (Y scale 0...0.7) |
| 4 |
▲ | QC1DB |
MEDIAN |
0.117 |
counts/sec |
VAL | 0.06,0.10 |
14 |
lamp_effic |
this |
last_yr |
all
|
as plot 1, IFU2 (Y scale 0...0.7) |
| 5 |
• | QC1DB |
MEDIAN |
0.0649 |
counts/sec |
VAL | 0.03,0.08 |
15 |
lamp_effic |
this |
last_yr |
all
|
as plot 1, Argus (Y scale 0...0.7) |
| 6 |
x | QC1DB |
MEDIAN |
3.23 |
counts/sec |
VAL | 1.6,3.5 |
35 |
lamp_effic |
this |
last_yr |
all
|
ARCLAMP efficiency; L543.1, Medusa1 |
| 7 |
x | QC1DB |
MEDIAN |
3.22 |
counts/sec |
VAL | 1.6,3.5 |
30 |
lamp_effic |
this |
last_yr |
all
|
... same for Medusa2 |
| |
|
*Data sources: QC1DB: QC1 database; LOCAL: local data source
|
Plot 1
scores:  2| 2|
| | data source: | giraffe_wave
(QC1 database) |
| dataset: | lamp_effic | • |
| median: | 0.504 | counts/sec |
| fixed thresholds: | 0.3...0.5 | counts/sec |
| N_data plotted: | 25 |
| [click plot for closeup] |
Plot 2
scores:  3| 3|
| | data source: | giraffe_wave
(QC1 database) |
| dataset: | lamp_effic | x |
| median: | 0.504 | counts/sec |
| fixed thresholds: | 0.3...0.5 | counts/sec |
| N_data plotted: | 25 |
| [click plot for closeup] |
Plot 3
scores: 1|
| | data source: | giraffe_wave
(QC1 database) |
| dataset: | lamp_effic | ∗ |
| median: | 0.109 | counts/sec |
| fixed thresholds: | 0.06...0.1 | counts/sec |
| N_data plotted: | 13 |
| [click plot for closeup] |
Plot 4
scores: 2|
| | data source: | giraffe_wave
(QC1 database) |
| dataset: | lamp_effic | ▲ |
| median: | 0.117 | counts/sec |
| fixed thresholds: | 0.06...0.1 | counts/sec |
| N_data plotted: | 14 |
| [click plot for closeup] |
Plot 5
scores: 2|
| | data source: | giraffe_wave
(QC1 database) |
| dataset: | lamp_effic | • |
| median: | 0.0649 | counts/sec |
| fixed thresholds: | 0.03...0.08 | counts/sec |
| N_data plotted: | 15 |
| [click plot for closeup] |
Plot 6
scores: 2|
| | data source: | giraffe_wave
(QC1 database) |
| dataset: | lamp_effic | x |
| median: | 3.23 | counts/sec |
| fixed thresholds: | 1.6...3.5 | counts/sec |
| N_data plotted: | 35 |
| [click plot for closeup] |
Plot 7
scores: 4|
| | data source: | giraffe_wave
(QC1 database) |
| dataset: | lamp_effic | x |
| median: | 3.22 | counts/sec |
| fixed thresholds: | 1.6...3.5 | counts/sec |
| N_data plotted: | 30 |
| [click plot for closeup] |
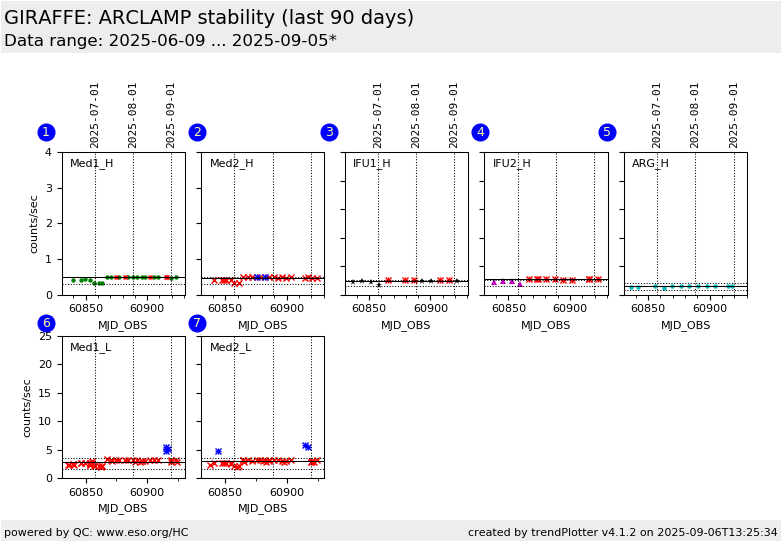
This is the Health Check plot to monitor the efficiency of the
GIRAFFE arclamp.
We display the QC1 parameter lamp_effic
which is the average (mean intensity/EXPTIME) flux of all emission lines, in ADU/sec, for
all fibres except for the SIMCAL fibres.
This plot monitors the
HC data taken in high resolution (H525.8B, all slits, box 1-5) and low resolution (L543.1, Medusa1
and 2 only, boxes 6 and 7).
If the intensity drops in one of the fibre systems, there is most likely a
problem with that fibre system. If the fibre systems
all drop simultaneously,
this is likely to be a problem with the calibration lamp itself.
The quality of the arclamp exposures is quite critical for the quality of the
dispersion solution. An intensity drop increases the rms of
the dispersion solution significantly (see rms plot under "wavelength
calibration", around epoch 2007-10).
General information
Click on any of the plots to see a close-up version.
The latest date is indicated on top of the plot.
If configured,
- data points belonging to the latest date are specially marked
- statistical averages are indicated by a solid line, and thresholds by broken lines
- outliers are marked by a red asterisk. They are defined as data points outside the
threshold lines
- "aliens" (= data points outside the plot Y limits) are marked by a red arrow (↑ or ↓)
- you can download the data for each parameter set if the 'Data downloads' link shows up
|
