Plot
? |
Symb
? |
Source
* |
Average ? |
Thresholds ? |
N_
data |
QC1
parameter |
Data
downloads |
Remarks |
| method |
value |
unit |
method |
value |
| 1 |
• | QC1DB |
MEDIAN |
0 |
none |
VAL | 0,2 |
15 |
badpix_ft |
this |
last_yr |
all
|
bad pixels, Fringe Tracker (FT) detector, SPLIT polarimetry |
| 2 |
• | QC1DB |
MEDIAN |
2 |
none |
VAL | 0,5 |
15 |
badpix_sc |
this |
last_yr |
all
|
bad pixels, Science Camera (SC) detector, SPLIT polarimetry |
| 3 |
• | QC1DB |
MEDIAN |
0 |
none |
VAL | 0,2 |
12 |
badpix_ft |
this |
last_yr |
all
|
bad pixels, Fringe Tracker (FT) detector, COMBINED polarimetry |
| 4 |
• | QC1DB |
MEDIAN |
1 |
none |
VAL | 0,5 |
12 |
badpix_sc |
this |
last_yr |
all
|
bad pixels, Science Camera (SC) detector, COMBINED polarimetry |
| 5 |
• | QC1DB |
MEDIAN |
26.2 |
ADU/e |
none | |
15 |
gainmean_ft |
this |
last_yr |
all
|
gain, Fringe Tracker (FT) detector, SPLIT polarimetry |
| 6 |
• | QC1DB |
MEDIAN |
1.16 |
ADU/e |
none | |
15 |
gainmean_sc |
this |
last_yr |
all
|
gain, Science Camera (SC) detector, SPLIT polarimetry |
| 7 |
• | QC1DB |
MEDIAN |
25.5 |
ADU/e |
none | |
12 |
gainmean_ft |
this |
last_yr |
all
|
gain, Fringe Tracker (FT) detector, COMBINED polarimetry |
| 8 |
• | QC1DB |
MEDIAN |
0.914 |
ADU/e |
none | |
12 |
gainmean_sc |
this |
last_yr |
all
|
gain, Science Camera (SC) detector, COMBINED polarimetry |
| |
|
*Data sources: QC1DB: QC1 database; LOCAL: local data source
|
Plot 1
scores:  1| 1|
| | data source: | gravity_p2vm
(QC1 database) |
| dataset: | badpix_ft | • |
| median: | 0 | none |
| fixed thresholds: | 0...2 | none |
| N_data plotted: | 15 |
| [click on plot for closeup] |
Plot 2
scores: 1|
| | data source: | gravity_p2vm
(QC1 database) |
| dataset: | badpix_sc | • |
| median: | 2 | none |
| fixed thresholds: | 0...5 | none |
| N_data plotted: | 15 |
| [click on plot for closeup] |
Plot 3
scores: 2|
| | data source: | gravity_p2vm
(QC1 database) |
| dataset: | badpix_ft | • |
| median: | 0 | none |
| fixed thresholds: | 0...2 | none |
| N_data plotted: | 12 |
| [click on plot for closeup] |
Plot 4
scores: 2|
| | data source: | gravity_p2vm
(QC1 database) |
| dataset: | badpix_sc | • |
| median: | 1 | none |
| fixed thresholds: | 0...5 | none |
| N_data plotted: | 12 |
| [click on plot for closeup] |
Plot 5
scores: no current data
| | data source: | gravity_p2vm
(QC1 database) |
| dataset: | gainmean_ft | • |
| median: | 26.2 | ADU/e |
| thresholds: | none | |
| N_data plotted: | 15 |
| [click on plot for closeup] |
Plot 6
scores: no current data
| | data source: | gravity_p2vm
(QC1 database) |
| dataset: | gainmean_sc | • |
| median: | 1.16 | ADU/e |
| thresholds: | none | |
| N_data plotted: | 15 |
| [click on plot for closeup] |
Plot 7
scores: no current data
| | data source: | gravity_p2vm
(QC1 database) |
| dataset: | gainmean_ft | • |
| median: | 25.5 | ADU/e |
| thresholds: | none | |
| N_data plotted: | 12 |
| [click on plot for closeup] |
Plot 8
scores: no current data
| | data source: | gravity_p2vm
(QC1 database) |
| dataset: | gainmean_sc | • |
| median: | 0.914 | ADU/e |
| thresholds: | none | |
| N_data plotted: | 12 |
| [click on plot for closeup] |
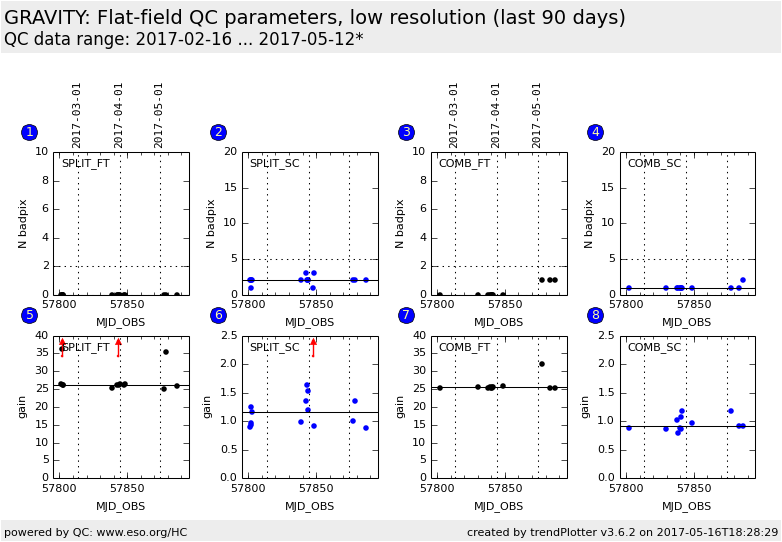
Trending plot for number of bad pixels and gain of the Fringe Tracker (FT) and Science Camera
(SC) detectors. Plotted are data taken with LOW spectral resolution.
NOTE: gain values show rather strong fluctuation which is likely due to the
measuring method. This needs to be revised.
General information
Click on any of the plots to see a close-up version.
The latest date is indicated on top of the plot.
If configured,
- data points belonging to the latest date are specially marked
- statistical averages are indicated by a solid line, and thresholds by broken lines
- outliers are marked by a red asterisk. They are defined as data points outside the
threshold lines
- "aliens" (= data points outside the plot Y limits) are marked by a red arrow (↑ or ↓)
- you can download the data for each parameter set if the 'Data downloads' link shows up
|
