MIDI trending system: FULL report
Last update: 2015-03-06T18:46:49 (UT)
[enable javascript for displaying time difference!]
General news:
NOTE: The Health Check and calChecker services have been moved to qcFlow. These pages are only maintained for comparison
and will be removed in 2026.
MIDI news:
2015-03-04: last night of MIDI operations
Report news:
Plot? Symb? Source Average ? Thresholds ? N_ QC1 Data Remarks
method value unit method value
1
• QC1DB none NONE VAL 0.6,1.2 1816 kappa11_median
all (full time range)
flux in interferometric window 1 from telescope 1
2
• QC1DB none NONE VAL 0.6,1.2 1816 kappa12_median
all (full time range)
flux in interferometric window 1 from telescope 2
3
• QC1DB none NONE VAL 0.6,1.2 1816 kappa21_median
all (full time range)
flux in interferometric window 2 from telescope 1
4
• QC1DB none NONE VAL 0.6,1.2 1816 kappa22_median
all (full time range)
flux in interferometric window 2 from telescope 2
5
• QC1DB none NONE VAL 0.6,1.2 46 kappa11_median
all (full time range)
flux in interferometric window 1 from telescope 1
6
• QC1DB none NONE VAL 0.6,1.2 46 kappa12_median
all (full time range)
flux in interferometric window 1 from telescope 2
7
• QC1DB none NONE VAL 0.6,1.2 46 kappa21_median
all (full time range)
flux in interferometric window 2 from telescope 1
8
• QC1DB none NONE VAL 0.6,1.2 46 kappa22_median
all (full time range)
flux in interferometric window 2 from telescope 2
*Data sources: QC1DB: QC1 database; LOCAL: local data source
Plot 1 scores: not implemented
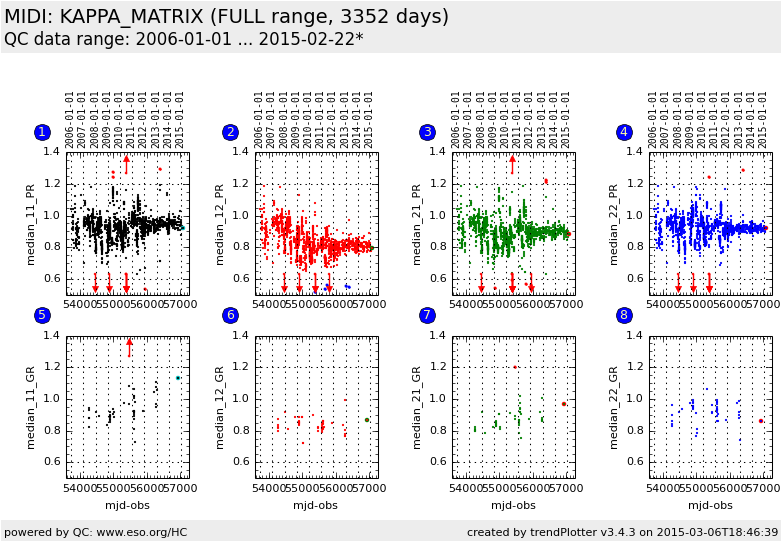
data source: midi_kappamatrix dataset: kappa11_median • average: none fixed thresholds: 0.6...1.2 NONE N_data plotted: 1816 [click on plot for closeup]
Plot 2 scores: not implemented
data source: midi_kappamatrix dataset: kappa12_median • average: none fixed thresholds: 0.6...1.2 NONE N_data plotted: 1816 [click on plot for closeup]
Plot 3 scores: not implemented
data source: midi_kappamatrix dataset: kappa21_median • average: none fixed thresholds: 0.6...1.2 NONE N_data plotted: 1816 [click on plot for closeup]
Plot 4 scores: not implemented
data source: midi_kappamatrix dataset: kappa22_median • average: none fixed thresholds: 0.6...1.2 NONE N_data plotted: 1816 [click on plot for closeup]
Plot 5 scores: not implemented
data source: midi_kappamatrix dataset: kappa11_median • average: none fixed thresholds: 0.6...1.2 NONE N_data plotted: 46 [click on plot for closeup]
Plot 6 scores: not implemented
data source: midi_kappamatrix dataset: kappa12_median • average: none fixed thresholds: 0.6...1.2 NONE N_data plotted: 46 [click on plot for closeup]
Plot 7 scores: not implemented
data source: midi_kappamatrix dataset: kappa21_median • average: none fixed thresholds: 0.6...1.2 NONE N_data plotted: 46 [click on plot for closeup]
Plot 8 scores: not implemented
data source: midi_kappamatrix dataset: kappa22_median • average: none fixed thresholds: 0.6...1.2 NONE N_data plotted: 46 [click on plot for closeup]
This plot
In SCIPHOT mode, we need to define the splitting ratio between the photometric and the interferometric channels. This is given by the cofficients of the Kappa Matrix.
General information
Click on any of the plots to see a close-up version .
The latest date is indicated on top of the plot.
If configured,
data points belonging to the latest date are specially marked statistical averages are indicated by a solid line, and thresholds by broken lines outliers are marked by a red asterisk. They are defined as data points outside the
threshold lines "aliens" (= data points outside the plot Y limits) are marked by a red arrow (↑ ↓ you can download the data for each parameter set if the 'Data downloads' link shows up

