MIDI trending system: HEALTH CHECK report
Last update: 2015-03-05T19:41:58 (UT)
[enable javascript for displaying time difference!]
General news:
NOTE: The Health Check and calChecker services are moved to qcFlow on an instrument by instrument basis. The current pages will not be updated any longer once the move has been finished.
MIDI news:
2015-03-04: last night of MIDI operations
Report news:
Plot? Symb? Source Average ? Thresholds ? N_ QC1 Data Remarks
method value unit method value
1
• QC1DB none NONE VAL 100000,5000000 13 targ_photA2
this |
last_yr |
all
alfhya
1
• QC1DB none NONE VAL 100000,5000000 13 targ_photA2
this |
last_yr |
all
alftau
1
• QC1DB none NONE VAL 100000,5000000 29 targ_photA2
this |
last_yr |
all
etasgr
1
• QC1DB none NONE VAL 100000,5000000 3 targ_photA2
this |
last_yr |
all
alfboo
1
• QC1DB none NONE VAL 100000,5000000 5 targ_photA2
this |
last_yr |
all
siglib
1
• QC1DB none NONE VAL 100000,5000000 9 targ_photA2
this |
last_yr |
all
alfcma
2
• QC1DB none NONE VAL 100000,5000000 13 targ_photB2
this |
last_yr |
all
alfhya
2
• QC1DB none NONE VAL 100000,5000000 13 targ_photB2
this |
last_yr |
all
alftau
2
• QC1DB none NONE VAL 100000,5000000 29 targ_photB2
this |
last_yr |
all
etasgr
2
• QC1DB none NONE VAL 100000,5000000 3 targ_photB2
this |
last_yr |
all
alfboo
2
• QC1DB none NONE VAL 100000,5000000 5 targ_photB2
this |
last_yr |
all
siglib
2
• QC1DB none NONE VAL 100000,5000000 9 targ_photB2
this |
last_yr |
all
alfcma
*Data sources: QC1DB: QC1 database; LOCAL: local data source
Plot 1 scores: not implemented
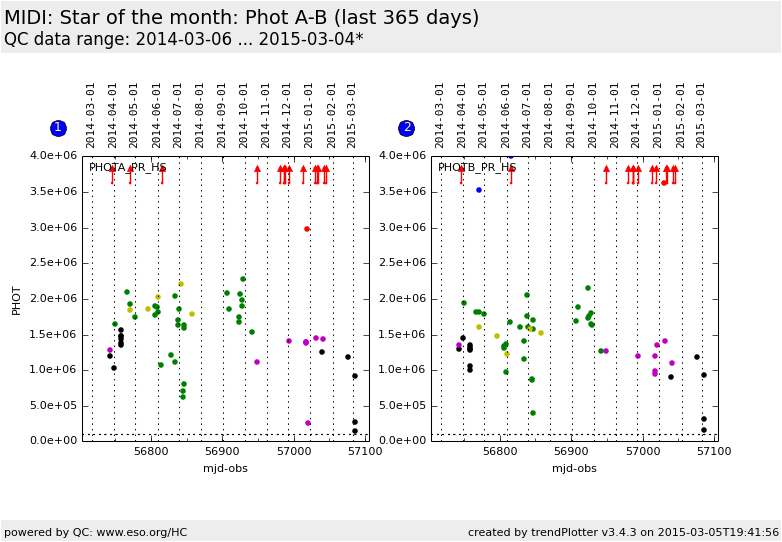
data source: midi_TransferFunction dataset: targ_photA2 • average: none fixed thresholds: 100000...5000000 NONE N_data plotted: 13 [click on plot for closeup]
Plot 2 scores: not implemented
data source: midi_TransferFunction dataset: targ_photB2 • average: none fixed thresholds: 100000...5000000 NONE N_data plotted: 13 [click on plot for closeup]
This plot
The Photometry is trended on the Star of the month
using the QC keyword QC PHOTx TARG2. TARG2 is measured at 10.48 microns.
General information
Click on any of the plots to see a close-up version .
The latest date is indicated on top of the plot.
If configured,
data points belonging to the latest date are specially marked statistical averages are indicated by a solid line, and thresholds by broken lines outliers are marked by a red asterisk. They are defined as data points outside the
threshold lines "aliens" (= data points outside the plot Y limits) are marked by a red arrow (↑ ↓ you can download the data for each parameter set if the 'Data downloads' link shows up

