mirror sites: PL (internal link) HQ     [?]

Health Check monitor


CAL | HC | refs | QC
HealthCheck Monitor
   HOME | UsersGuide
  sl icon ALL INSTRUMENTS
NACO:
detector: dark
Other HC:
QC links:
        [page auto-refreshes after 300 sec]   [stop | on]            [press Ctrl+Shift+R to enforce refresh of scores, dates and news]
NACO trending system: HEALTH CHECK report
HELP USERS-GUIDE MORE
Last update: 2013-05-22T12:01:55 (UT)
  | now: 2013-05-22T22:19:24 (UT) muc04 QC pipeline: naco-4.3.3 (installed 2013-04-15)
same group: RON_DAILY RON_NONDAILY   8-col-noise
General news: Click 'scores&comments' to switch to score details, and 'HC plot' to switch back to the graphics.
NACO news:  
Report news: 2013-05-16 High RON values of DCR_HD_2.0 from 2013-05-11,12,14 are from cube mode darks. [whummel@eso.org]
DATE*: [?] 2013-05-15
report | NLT
2013-05-16
report | NLT
2013-05-17
report | NLT
2013-05-18
report | NLT
2013-05-19
report | NLT
2013-05-20
report | NLT
2013-05-21
report | NLT
2013-05-22
no data | NLT
P...
Product quality:
products products products products products products products no products
  last OPSLOG data:
2013-05-19*

last files ...
monitor

scores&comments | history ... | plot tutorial ... | contact               [?]
*Date on this monitor changes at 21:00 UT
Print: Information and research:
- png file - advanced studies: QC1 browser | QC1 plotter
Plot
?
Symb
?
Source
*
OPS?
**
Average ? Thresholds ? N_
data
QC1
parameter
Data
downloads
Remarks
method value unit method value
1 QC1DB yes (0) MEDIAN 4.9   VAL3,6 30 dark_ron12 this | last_yr | all Double_ReadResetRead HighDynamic DIT=0.5
2 oQC1DB yes (0) MEDIAN 4.25   VAL3,6 16 dark_ron12 this | last_yr | all Double_ReadResetRead HighDynamic DIT=2.0
3 *QC1DB yes (3) MEDIAN 5.18   VAL3,7 33 dark_ron12 this | last_yr | all Uncorr HighWellDepth DIT=0.2s
4 QC1DB yes (0) MEDIAN 2.4   VAL2,4.0 30 dark_median this | last_yr | all Double_ReadResetRead HighDynamic DIT=0.5
5 oQC1DB yes (0) MEDIAN 2.82   VAL2,4.0 16 dark_median this | last_yr | all Double_ReadResetRead HighDynamic DIT=2.0
6 *QC1DB yes (3) MEDIAN -7.78e+03   VAL-7900,-7700 33 dark_median this | last_yr | all Uncorr HighWellDepth DIT=0.2s
*Data sources: QC1DB: QC1 database; LOCAL: local text file | **OPS: OPSLOG data are included
Plot 1
scores: not implemented
data source:naco_dark
(QC1 database)
dataset:dark_ron12
median:4.9 
fixed thresholds:3...6 
N_data plotted:30
[click on plot for closeup]
Plot 2
scores: not implemented
data source:naco_dark
(QC1 database)
dataset:dark_ron12o
median:4.25 
fixed thresholds:3...6 
N_data plotted:16
[click on plot for closeup]
Plot 3
scores: not implemented
data source:naco_dark
(QC1 database)
dataset:dark_ron12*
median:5.18 
fixed thresholds:3...7 
N_data plotted:33
[click on plot for closeup]
Plot 4
scores: not implemented
data source:naco_dark
(QC1 database)
dataset:dark_median
median:2.4 
fixed thresholds:2...4.0 
N_data plotted:30
[click on plot for closeup]
Plot 5
scores: not implemented
data source:naco_dark
(QC1 database)
dataset:dark_mediano
median:2.82 
fixed thresholds:2...4.0 
N_data plotted:16
[click on plot for closeup]
Plot 6
scores: not implemented
data source:naco_dark
(QC1 database)
dataset:dark_median*
median:-7.78e+03 
fixed thresholds:-7900...-7700 
N_data plotted:33
[click on plot for closeup]
This plot

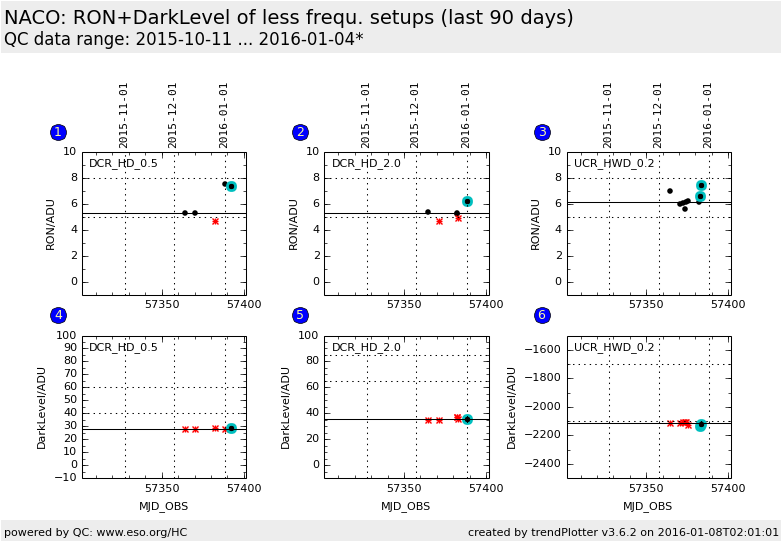
This plot shows the dark level and the readout noise of the three acquired dark calibration setups, triggered by calobuild (DET.NCORRS.NAME, DET.MODE.NAME, DET.DIT in sec).

  • Double_ReadResetRead, HighDensity, 0.5
  • Double_ReadResetRead, HighDensity, 2.0
  • Uncorr, HighWellDepth, 0.2
 
General information

Click on any of the plots to see a close-up version.

If applicable, the latest values from Paranal ops logs are plotted as blue dots. More information about those values, including a download option, is available in the OPS column.

The latest date is indicated on top of the plot, data points belonging to that date are specially marked.

If configured,

  • statistical averages are indicated by a solid line, and thresholds by broken lines
  • outliers are marked by a red asterisk. They are defined as data points outside the threshold lines
  • "aliens" (= data points outside the plot Y limits) are marked by a red arrow ( or )
  • you can download the data for each parameter set if the 'Data downloads' link shows up