Plot
? |
Symb
? |
Source
* |
Average ? |
Thresholds ? |
N_
data |
QC1
parameter |
Data
downloads |
Remarks |
| method |
value |
unit |
method |
value |
| 1 |
• | QC1DB |
MEDIAN |
-0.18 |
fraction |
VAL | -0.2,0.2 |
85 |
non_linear |
this |
last_yr |
all
|
Double_RdRstRd/HighDynamic non-linearity |
| 2 |
• | QC1DB |
MEDIAN |
-0.12 |
fraction |
VAL | -0.3,0.1 |
83 |
non_linear |
this |
last_yr |
all
|
FowlerNsamp/HighSensitivity non-linearity |
| 3 |
• | QC1DB |
MEDIAN |
0.0453 |
fraction |
VAL | -0.2,0.2 |
13 |
non_linear |
this |
last_yr |
all
|
Uncorr/HighWellDepth non-linearity |
| 4 |
• | QC1DB |
MEDIAN |
0.0742 |
fraction |
VAL | -0.2,0.2 |
12 |
non_linear |
this |
last_yr |
all
|
Uncorr/HighDynamic non-linearity |
| |
|
*Data sources: QC1DB: QC1 database; LOCAL: local data source
|
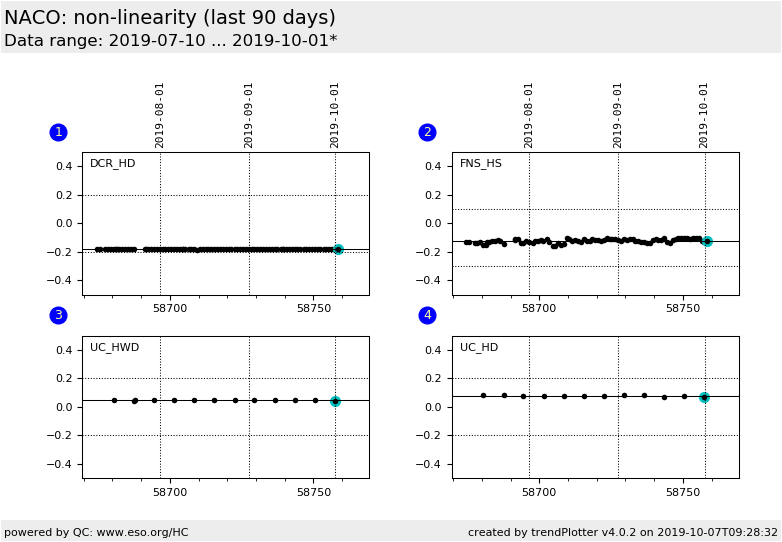
Plot 1
scores: no current data
| | data source: | naco_detmon
(QC1 database) |
| dataset: | non_linear | • |
| median: | -0.18 | fraction |
| fixed thresholds: | -0.2...0.2 | fraction |
| N_data plotted: | 85 |
| [click plot for closeup] |
Plot 2
scores: no current data
| | data source: | naco_detmon
(QC1 database) |
| dataset: | non_linear | • |
| median: | -0.12 | fraction |
| fixed thresholds: | -0.3...0.1 | fraction |
| N_data plotted: | 83 |
| [click plot for closeup] |
Plot 3
scores: no current data
| | data source: | naco_detmon
(QC1 database) |
| dataset: | non_linear | • |
| median: | 0.0453 | fraction |
| fixed thresholds: | -0.2...0.2 | fraction |
| N_data plotted: | 13 |
| [click plot for closeup] |
Plot 4
scores: no current data
| | data source: | naco_detmon
(QC1 database) |
| dataset: | non_linear | • |
| median: | 0.0742 | fraction |
| fixed thresholds: | -0.2...0.2 | fraction |
| N_data plotted: | 12 |
| [click plot for closeup] |
This plot shows also the detector non-linearity at reference
counts levels of (configured in the detmon recipe for each read mode
individually ):
- Double_RdRstRd, HighDynamic, non-linearity reference counts level at 8000 ADU.
- FowlerNsamp, HighSensitivity, non-linearity reference counts level at 2000 ADU.
- Uncorr, HighWellDepth, non-linearity reference counts level at 8000 ADU.
- Uncorr, HighDynamic, non-linearity reference counts level at 8000 ADU.
General information
Click on any of the plots to see a close-up version.
The latest date is indicated on top of the plot.
If configured,
- data points belonging to the latest date are specially marked
- statistical averages are indicated by a solid line, and thresholds by broken lines
- outliers are marked by a red asterisk. They are defined as data points outside the
threshold lines
- "aliens" (= data points outside the plot Y limits) are marked by a red arrow (↑ or ↓)
- you can download the data for each parameter set if the 'Data downloads' link shows up
|
