Plot
? |
Symb
? |
Source
* |
Average ? |
Thresholds ? |
N_
data |
QC1
parameter |
Data
downloads |
Remarks |
| method |
value |
unit |
method |
value |
| 1 |
• | QC1DB |
MEDIAN |
9.68 |
e-/ADU |
none | |
54 |
gain |
this |
last_yr |
all
|
gain in e-/ADU, for any Filter, S13, Double_RdRstRd (and DIT=15sec) |
| 1 |
• | QC1DB |
none |
|
|
none | |
16 |
gain |
this |
last_yr |
all
|
gain in e-/ADU, for J, S13, Double_RdRstRd (and DIT=15sec) |
| 1 |
• | QC1DB |
none |
|
|
none | |
15 |
gain |
this |
last_yr |
all
|
gain in e-/ADU, for H, S13, Double_RdRstRd (and DIT=15sec) |
| 1 |
• | QC1DB |
none |
|
|
none | |
17 |
gain |
this |
last_yr |
all
|
gain in e-/ADU, for Ks, S13, Double_RdRstRd (and DIT=15sec) |
| 2 |
• | QC1DB |
MEDIAN |
10.4 |
e-/ADU |
none | |
19 |
gain |
this |
last_yr |
all
|
gain in e-/ADU, for any Filter, S13, FowlerNsamp (and DIT=15sec) |
| 2 |
• | QC1DB |
none |
|
|
none | |
1 |
gain |
this |
last_yr |
all
|
gain in e-/ADU, for J, S13, FowlerNsamp (and DIT=15sec) |
| 2 |
• | QC1DB |
none |
|
|
none | |
1 |
gain |
this |
last_yr |
all
|
gain in e-/ADU, for H, S13, FowlerNsamp (and DIT=15sec) |
| 2 |
• | QC1DB |
none |
|
|
none | |
8 |
gain |
this |
last_yr |
all
|
gain in e-/ADU, for Ks, S13, FowlerNsamp (and DIT=15sec) |
| |
|
*Data sources: QC1DB: QC1 database; LOCAL: local data source
|
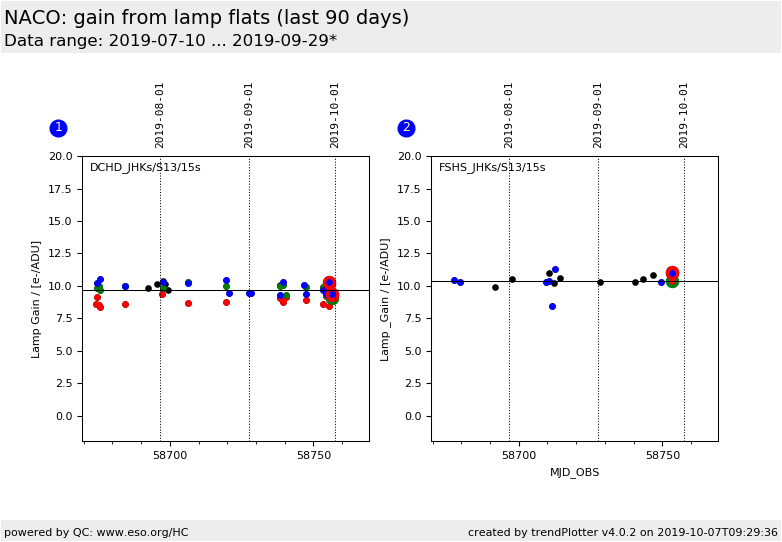
Plot 1
scores: not implemented
| | data source: | naco_lampflat
(QC1 database) |
dataset:
(numbers below apply to this dataset) | gain | • |
| median: | 9.68 | e-/ADU |
| thresholds: | none | |
| N_data plotted: | 54 |
| [click plot for closeup] |
Plot 2
scores: not implemented
| | data source: | naco_lampflat
(QC1 database) |
dataset:
(numbers below apply to this dataset) | gain | • |
| median: | 10.4 | e-/ADU |
| thresholds: | none | |
| N_data plotted: | 19 |
| [click plot for closeup] |
Detector gain, a conversion factor in e-/ADU, estimated from the daily
internal lamp flatfields as a fallback solution for the detector monitoring
data. Values are derived by the naco_img_lampflat
recipe of the NACO pipeline. The data points are separated according
to read modes:
- Double_RdRstRd HighDensity, DIT=15sec, S13, J, H or Ks filter
- FowlerNsamp HighSensitivity, DIT=15sec, S13, J, H or Ks filter
General information
Click on any of the plots to see a close-up version.
The latest date is indicated on top of the plot.
If configured,
- data points belonging to the latest date are specially marked
- statistical averages are indicated by a solid line, and thresholds by broken lines
- outliers are marked by a red asterisk. They are defined as data points outside the
threshold lines
- "aliens" (= data points outside the plot Y limits) are marked by a red arrow (↑ or ↓)
- you can download the data for each parameter set if the 'Data downloads' link shows up
|
