Plot
? |
Symb
? |
Source
* |
Average ? |
Thresholds ? |
N_
data |
QC1
parameter |
Data
downloads |
Remarks |
| method |
value |
unit |
method |
value |
| 1 |
• | QC1DB |
none |
|
ADU |
VAL | 50,10000 |
8 |
strehl_peak |
this |
last_yr |
all
|
Ks peak counts for standard stars in S13 |
| 1 |
• | QC1DB |
none |
|
ADU |
VAL | 50,10000 |
3 |
strehl_peak |
this |
last_yr |
all
|
Ks peak counts for standard stars in S27 |
| 1 |
• | QC1DB |
none |
|
ADU |
VAL | 50,10000 |
2 |
strehl_peak |
this |
last_yr |
all
|
Ks peak counts for standard stars in S54 |
| 2 |
• | QC1DB |
none |
|
ADU |
VAL | 50,10000 |
5 |
strehl_peak |
this |
last_yr |
all
|
H peak counts for standard stars in S13 |
| 2 |
• | QC1DB |
none |
|
ADU |
VAL | 50,10000 |
3 |
strehl_peak |
this |
last_yr |
all
|
H peak counts for standard stars in S27 |
| 2 |
• | QC1DB |
none |
|
ADU |
VAL | 50,10000 |
2 |
strehl_peak |
this |
last_yr |
all
|
H peak counts for standard stars in S54 |
| 3 |
• | QC1DB |
none |
|
ADU |
VAL | 50,10000 |
4 |
strehl_peak |
this |
last_yr |
all
|
J peak counts for standard stars in S13 |
| 3 |
• | QC1DB |
none |
|
ADU |
VAL | 50,10000 |
2 |
strehl_peak |
this |
last_yr |
all
|
J peak counts for standard stars in S27 |
| 3 |
• | QC1DB |
none |
|
ADU |
VAL | 50,10000 |
2 |
strehl_peak |
this |
last_yr |
all
|
J peak counts for standard stars in S54 |
| |
|
*Data sources: QC1DB: QC1 database; LOCAL: local data source
|
Plot 1
scores: not implemented
| | data source: | naco_zp
(QC1 database) |
dataset:
(numbers below apply to this dataset) | strehl_peak | • |
| average: | none |
| fixed thresholds: | 50...10000 | ADU |
| N_data plotted: | 8 |
| [click plot for closeup] |
Plot 2
scores: not implemented
| | data source: | naco_zp
(QC1 database) |
dataset:
(numbers below apply to this dataset) | strehl_peak | • |
| average: | none |
| fixed thresholds: | 50...10000 | ADU |
| N_data plotted: | 5 |
| [click plot for closeup] |
Plot 3
scores: not implemented
| | data source: | naco_zp
(QC1 database) |
dataset:
(numbers below apply to this dataset) | strehl_peak | • |
| average: | none |
| fixed thresholds: | 50...10000 | ADU |
| N_data plotted: | 4 |
| [click plot for closeup] |
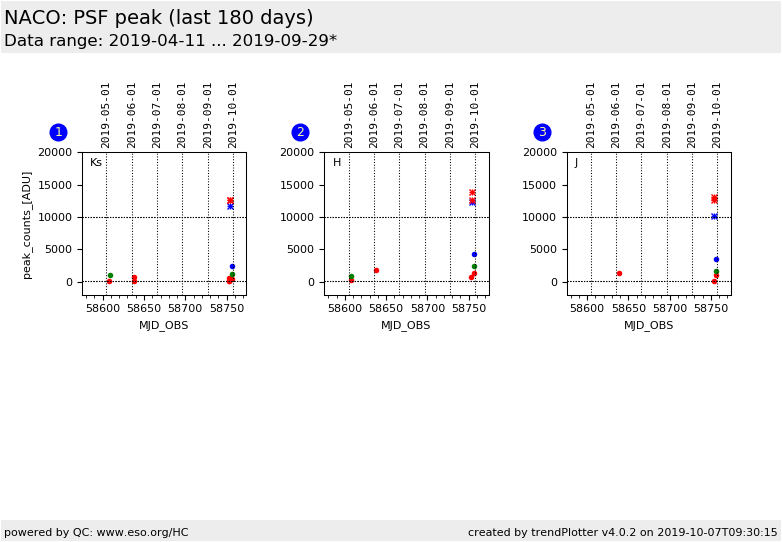
This plot shows the peak counts of the photometric standard star observation as calculated by the strehl recipe.
Standard stars (filters: H, J, Ks and cameras: S13, S27, S54) are acquired with
readmode Double_RdRstRd, HighDynamic, for which the detector saturates at
~14000 ADU. Photometric zeropoints with peak values larger than 10000 ADU are therefore biased by the
non-linear response range of the detector.
Standard stars acquired with filter Lprime and camera L27 use the Uncorr
HighWellDepth readmode, which saturates at 21500 ADU.
General information
Click on any of the plots to see a close-up version.
The latest date is indicated on top of the plot.
If configured,
- data points belonging to the latest date are specially marked
- statistical averages are indicated by a solid line, and thresholds by broken lines
- outliers are marked by a red asterisk. They are defined as data points outside the
threshold lines
- "aliens" (= data points outside the plot Y limits) are marked by a red arrow (↑ or ↓)
- you can download the data for each parameter set if the 'Data downloads' link shows up
|
