Plot
? |
Symb
? |
Source
* |
Average ? |
Thresholds ? |
N_
data |
QC1
parameter |
Data
downloads |
Remarks |
| method |
value |
unit |
method |
value |
| 1 |
• | QC1DB |
none |
|
Mag |
none | |
8 |
zpoint |
this |
last_yr |
all
|
Ks zeropoints for standard stars, S13 |
| 1 |
• | QC1DB |
none |
|
Mag |
none | |
3 |
zpoint |
this |
last_yr |
all
|
Ks zeropoints for standard stars, S27 |
| 1 |
• | QC1DB |
none |
|
Mag |
none | |
2 |
zpoint |
this |
last_yr |
all
|
Ks zeropoints for standard stars, S54 |
| 2 |
• | QC1DB |
none |
|
Mag |
none | |
5 |
zpoint |
this |
last_yr |
all
|
H zeropoints for standard stars, S13 |
| 2 |
• | QC1DB |
none |
|
Mag |
none | |
3 |
zpoint |
this |
last_yr |
all
|
H zeropoints for standard stars, S27 |
| 2 |
• | QC1DB |
none |
|
Mag |
none | |
2 |
zpoint |
this |
last_yr |
all
|
H zeropoints for standard stars, S54 |
| 3 |
• | QC1DB |
none |
|
Mag |
none | |
4 |
zpoint |
this |
last_yr |
all
|
J zeropoints for standard stars, S13 |
| 3 |
• | QC1DB |
none |
|
Mag |
none | |
2 |
zpoint |
this |
last_yr |
all
|
J zeropoints for standard stars, S27 |
| 3 |
• | QC1DB |
none |
|
Mag |
none | |
2 |
zpoint |
this |
last_yr |
all
|
J zeropoints for standard stars, S54 |
| |
|
*Data sources: QC1DB: QC1 database; LOCAL: local data source
|
Plot 1
scores: not implemented
| | data source: | naco_zp
(QC1 database) |
dataset:
(numbers below apply to this dataset) | zpoint | • |
| average: | none |
| thresholds: | none |
| N_data plotted: | 8 |
| [click plot for closeup] |
Plot 2
scores: not implemented
| | data source: | naco_zp
(QC1 database) |
dataset:
(numbers below apply to this dataset) | zpoint | • |
| average: | none |
| thresholds: | none |
| N_data plotted: | 5 |
| [click plot for closeup] |
Plot 3
scores: not implemented
| | data source: | naco_zp
(QC1 database) |
dataset:
(numbers below apply to this dataset) | zpoint | • |
| average: | none |
| thresholds: | none |
| N_data plotted: | 4 |
| [click plot for closeup] |
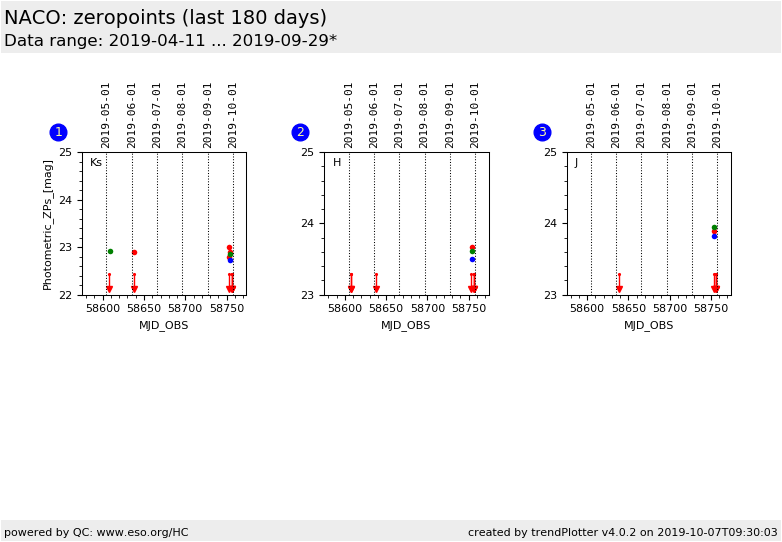
Photometric Zeropoints (not corrected for extinction) are shown for
three broad band filters Ks, H and J. They are derived from the
standard star observations taken in camera S13, S27 and S54 and the VIS dichroic.
Since 2018-07-17, data from both WFS/dichroic are shown
Low ZP values in the K-band (20mag) are from the N90C10 dicroic, while normal values (23mag) are from the N20C80 dicroic.
General information
Click on any of the plots to see a close-up version.
The latest date is indicated on top of the plot.
If configured,
- data points belonging to the latest date are specially marked
- statistical averages are indicated by a solid line, and thresholds by broken lines
- outliers are marked by a red asterisk. They are defined as data points outside the
threshold lines
- "aliens" (= data points outside the plot Y limits) are marked by a red arrow (↑ or ↓)
- you can download the data for each parameter set if the 'Data downloads' link shows up
|
