Plot
? |
Symb
? |
Source
* |
Average ? |
Thresholds ? |
N_
data |
QC1
parameter |
Data
downloads |
Remarks |
| method |
value |
unit |
method |
value |
| 1 |
o | QC1DB |
MEDIAN |
64 |
pixels |
VAL | 63.9,64.1 |
91 |
qc_sl_distavg |
this |
last_yr |
all
|
average of 32 slitlet distances in ALL filters (J, H, K, and H+K)
(this FULL data set is scored) |
| 1 |
• | QC1DB |
none |
|
pixels |
none | |
22 |
qc_sl_distavg |
this |
last_yr |
all
|
average slitlet distances: J-band |
| 1 |
• | QC1DB |
none |
|
pixels |
none | |
17 |
qc_sl_distavg |
this |
last_yr |
all
|
average slitlet distances: H-band |
| 1 |
• | QC1DB |
none |
|
pixels |
none | |
27 |
qc_sl_distavg |
this |
last_yr |
all
|
average slitlet distances: K-band |
| 1 |
• | QC1DB |
none |
|
pixels |
none | |
25 |
qc_sl_distavg |
this |
last_yr |
all
|
average slitlet distances: H+K band |
|
| 2 |
o | QC1DB |
MEDIAN |
0.501 |
pixels |
VAL | 0.21,0.98 |
91 |
qc_sl_distrms |
this |
last_yr |
all
|
rms scatter of 32 slitlet distances in ALL filters (J, H, K, and H+K)
(this FULL data set is scored) |
| 2 |
• | QC1DB |
none |
|
pixels |
none | |
22 |
qc_sl_distrms |
this |
last_yr |
all
|
rms of slitlet distances: J-band |
| 2 |
• | QC1DB |
none |
|
pixels |
none | |
17 |
qc_sl_distrms |
this |
last_yr |
all
|
rms of slitlet distances: H-band |
| 2 |
• | QC1DB |
none |
|
pixels |
none | |
27 |
qc_sl_distrms |
this |
last_yr |
all
|
rms of slitlet distances: K-band |
| 2 |
• | QC1DB |
none |
|
pixels |
none | |
25 |
qc_sl_distrms |
this |
last_yr |
all
|
rms of slitlet distances: H+K band |
|
| |
|
*Data sources: QC1DB: QC1 database; LOCAL: local data source
|
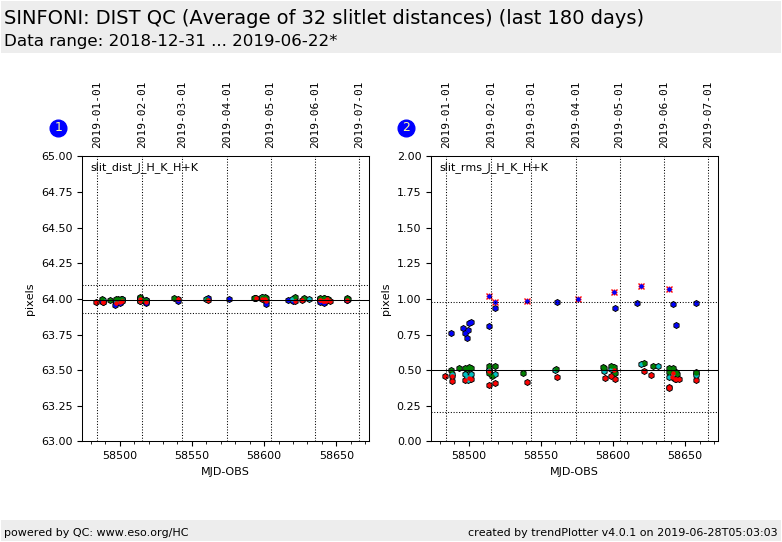
Plot 1
scores:  5| 5|
| | data source: | sinfoni_dist
(QC1 database) |
dataset:
(numbers below apply to this dataset) | qc_sl_distavg | o |
| median: | 64 | pixels |
| fixed thresholds: | 63.9...64.1 | pixels |
| N_data plotted: | 91 |
| [click plot for closeup] |
Plot 2
scores: not implemented
| | data source: | sinfoni_dist
(QC1 database) |
dataset:
(numbers below apply to this dataset) | qc_sl_distrms | o |
| median: | 0.501 | pixels |
| fixed thresholds: | 0.21...0.98 | pixels |
| N_data plotted: | 91 |
| [click plot for closeup] |
These are the trending plots for the SINFONI QC parameters derived from DISTORTION frames.
Distortion frames are obtained for the J, H, K, and H+K bandpasses,
but only for the 250 mas camera.
General information
Click on any of the plots to see a close-up version.
The latest date is indicated on top of the plot.
If configured,
- data points belonging to the latest date are specially marked
- statistical averages are indicated by a solid line, and thresholds by broken lines
- outliers are marked by a red asterisk. They are defined as data points outside the
threshold lines
- "aliens" (= data points outside the plot Y limits) are marked by a red arrow (↑ or ↓)
- you can download the data for each parameter set if the 'Data downloads' link shows up
|
