Plot
? |
Symb
? |
Source
* |
Average ? |
Thresholds ? |
N_
data |
QC1
parameter |
Data
downloads |
Remarks |
| method |
value |
unit |
method |
value |
| 1 |
• | QC1DB |
MEDIAN |
0.099976 |
ADU/sec |
VAL | 0.06,0.21 |
11 |
qc_backrate |
this |
last_yr |
all
|
H-band, DIT=30, no ND filter |
| 2 |
• | QC1DB |
MEDIAN |
14.7227 |
ADU/sec |
VAL | 10,26 |
11 |
qc_backrate |
this |
last_yr |
all
|
K-band, DIT=30, no ND filter |
| 3 |
• | QC1DB |
none |
|
ADU/sec |
none | |
1 |
qc_backrate |
this |
last_yr |
all
|
H-band, DIT=8.0, ND_1.0 |
| 3 |
• | QC1DB |
none |
|
ADU/sec |
none | |
0 |
qc_backrate |
this |
last_yr |
all
|
H-band, DIT=8.0, ND_2.0 |
| 3 |
• | QC1DB |
none |
|
ADU/sec |
none | |
0 |
qc_backrate |
this |
last_yr |
all
|
H-band, DIT=8.0, ND_3.5 |
| 4 |
• | QC1DB |
none |
|
ADU/sec |
none | |
7 |
qc_backrate |
this |
last_yr |
all
|
K-band, DIT=any, ND_1.0 |
| 4 |
• | QC1DB |
none |
|
ADU/sec |
none | |
6 |
qc_backrate |
this |
last_yr |
all
|
K-band, DIT=any, ND_2.0 |
| 4 |
• | QC1DB |
none |
|
ADU/sec |
none | |
0 |
qc_backrate |
this |
last_yr |
all
|
K-band, DIT=any, ND_3.5 |
| 4 |
• | QC1DB |
none |
|
C |
none | |
284 |
temp_bench |
this |
last_yr |
all
|
T(IFS), INS2.TEMP203.VAL, scaled |
| |
|
*Data sources: QC1DB: QC1 database; LOCAL: local data source
|
Plot 1
scores:  2| 2|
| | data source: | sphere_irdis_background
(QC1 database) |
| dataset: | qc_backrate | • |
| median: | 0.099976 | ADU/sec |
| fixed thresholds: | 0.06...0.21 | ADU/sec |
| N_data plotted: | 11 |
| [click plot for closeup] |
Plot 2
scores: 2|
| | data source: | sphere_irdis_background
(QC1 database) |
| dataset: | qc_backrate | • |
| median: | 14.7227 | ADU/sec |
| fixed thresholds: | 10...26 | ADU/sec |
| N_data plotted: | 11 |
| [click plot for closeup] |
Plot 3
scores: not implemented
| | data source: | sphere_irdis_background
(QC1 database) |
dataset:
(numbers below apply to this dataset) | qc_backrate | • |
| average: | none |
| thresholds: | none |
| N_data plotted: | 1 |
| [click plot for closeup] |
Plot 4
scores: not implemented
| | data source: | sphere_irdis_background
(QC1 database) |
dataset:
(numbers below apply to this dataset) | qc_backrate | • |
| average: | none |
| thresholds: | none |
| N_data plotted: | 7 |
| [click plot for closeup] |
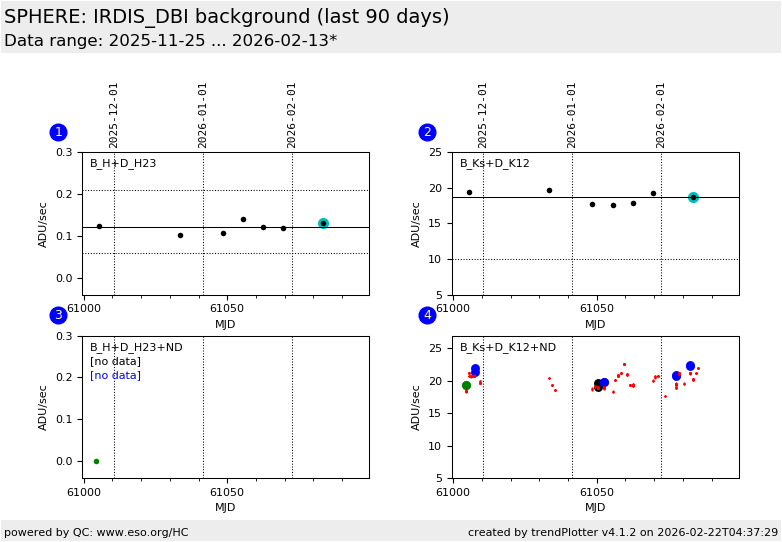
This plot shows the IRDIS DBI background in ADU/sec.
- (1) negligible background in the H-band (no ND filter)
- (2) stable background for the K-band
- (3) no background for H-band plus neutral density filters
- (4) K-band background correlates with the temperature of the neutral density filters.
Both temperature values (red and green little dots) are given in [C] and have been scaled via:
T(in the plot) = 1.452 T - 1.409
to fit the background rate values given in
[ADU/sec].
Note for (4): The neutral density filters (here ND_1.0 and ND_2.0)
used for IRDIS are located in the CPI. The same background is measured
for both ND filters, hence it is independent on the ND filter throughput.
The background is correlated with the CPI temperature.
General information
Click on any of the plots to see a close-up version.
The latest date is indicated on top of the plot.
If configured,
- data points belonging to the latest date are specially marked
- statistical averages are indicated by a solid line, and thresholds by broken lines
- outliers are marked by a red asterisk. They are defined as data points outside the
threshold lines
- "aliens" (= data points outside the plot Y limits) are marked by a red arrow (↑ or ↓)
- you can download the data for each parameter set if the 'Data downloads' link shows up
|
