VIRCAM: Detector linearity
| |
| HC PLOTS |
| non-linearity |
 |
| bad pixel fraction |
|
| brightest flat |
|
|
QC1 database (advanced users):
browse |
plot
|
The detector non-linearity template is called once a week. The series of
imaging flats and dark frames with increasing exposure time is processed
to obtain the non-linearity at a reference count level of 10000 ADU,
and the bad pixel map with the fraction of bad pixel.
The counts of the brightest flat accepted by the pipeline is monitored, as
non-linearity measures are very sensitive to the dynamic range analyzed.
The non-linearity product MASTER_CHANNEL_TABLE is used to calibrate
science data and photometric standard star field observations.
 Detector non-linearity
QC1_parameters
| FITS key |
QC1 database: table, name |
definition |
class* |
HC_plot** |
more docu |
| QC.LINEARITY | vircam_line..qc_linearity | % non-linearity at 10000 ADU | HC | | [docuSys coming] |
*Class: KPI - instrument performance; HC - instrument health; CAL - calibration quality; ENG - engineering parameter
**There might be more than one. |
Trending
The non-linearity is derived from a series of
dark-subtracted dome flats acquired with different
exposure times. The reference flux is at 10000
ADU. The non-linearity is expressed as the deviation
from linearity at 10000 ADU in percent and monitored here.
Three individual chips are highlighted by different
colors in the upper right box.
Scoring&thresholds Detector non-linearity
The specification is: less than 3%, which is not achieved for every chip at 10000 ADU.
Since non-linearity is corrected for by the standard star recipe and the science recipe,
it is not an issues and the thresholds are set to operational meaningful values to achieve
significance of the scoring system.
History
Between 2009-10-25 and 2009-11-20 additional noise and saturation showed up in channel #14 of chip #6.
Chip #6 shows in channel #14 sporadic large area saturation events. The effect was never seen in DARK or RESET frames. It becomes apparent in all 5 jitter frames of a standard star calibrations and in science frames. It can shows up also in twilight flat calibrations (e.g. the last three raw frames of the H-band twilight flat stack taken on 2009-11-23). No masking is provided within the calibration recipes of the data reduction pipeline operated at Paranal and at ESO HQ.
Impact:
- no stars can be extracted from that detector region to be compared with 2MASS for reasons to obtain a photometric zeropoint.
- twilight flat raw frames with this problems must not be used to generate a master twilight flat.
- science tiles composed of 6 paw prints match the sky region a second paw print in case the detector error does not show up in the second paw print.
The effect is monitored: For each first raw frame of a standard star stack the median flux of part of channel #14 region is measured and ingested into the QC1 database as qc_counts_C14. The same QC measure is applied to science paw prints, in case they are processed by QC in Garching.
 |
extract of chip #6 vircam observation in the region of channel #14.
|
The video card of chip #6 was replaced on 2009-11-20. As a side effect the linearity and the saturation level
changed with the replacement.
2019-11-16:
Due to the ongoing sporadic detector controller issues for chips #9-#16, both controllers were swapped on 2019-11-16T12:00:00.000 ( MJD-OBS = 58803.5 ).
Chips #1-#8 are operated with the controller previously used for chips #9-#16 and vice-versa. The non-linearity of chips #5, #6 and #14 are since this time slightly different.
Algorithm Detector non-linearity
The counts versus exposure time is expressed by a polynomial fit.
Bad pixel fraction
QC1_parameters
| FITS key |
QC1 database: table, name |
definition |
class* |
HC_plot** |
more docu |
| QC.BADFRAC | vircam_line..qc_badfrac | fraction of bad pixel | CAL |  | [docuSys coming] |
*Class: KPI - instrument performance; HC - instrument health; CAL - calibration quality; ENG - engineering parameter
**There might be more than one. |
Trending
Plot (1) shows the the average of the per detectror bad pixel fraction
Scoring&thresholds Bad pixel fraction
The specification is: less than 4% per chip, which is achieved. Thresholds are derived from statistical arguments.
History
- from 2020-12-14 on: new recipe command line paramater --maxbpmfr=[10 -> 50] to improve the number of bad pixel in chip #14.
- from 2021-02-01 on: new recipe command line paramater -lthr=[12 -> 22] to improve the number of bad pixel in chip #14.
Algorithm Bad pixel fraction
A pixel becomes bad, when the counts are beyond 8 sigma of the reference flat at the flat field combination step.
The reference flat is constructed by the pipeline recipe from raw in put frames.
Counts in brightest flat
QC1_parameters
| FITS key |
QC1 database: table, name |
definition |
class* |
HC_plot** |
more docu |
| QC.LINE_MEDMAX | vircam_line..qc_line_medmax | median counts in highest flux flat | CAL | | [docuSys coming] |
*Class: KPI - instrument performance; HC - instrument health; CAL - calibration quality; ENG - engineering parameter
**There might be more than one. |
While the weekly acquired linearity template data cover the
full dynamic range up to the very non-linear detector
response region, the analysis count range of the pipeline is confined
to the DET.SATURATION, a value that is hardcoded for each
individual detector in the PRO.CATG=CHANNEL_TABLE_INIT static calibration.
Trending
The monitoring of the individual chips in the upper right box of
the HC plot
shows that the retrieved non-linearity is based on a larger counts range in 2018.
Scoring&thresholds Counts in brightest flat
To be refined.
History
- Detector controller boards of the 'upper slave' have been replaced
in 2020-01 to find the cause of several image quality issues. The main
impact of the new boards on the detector non-linearity since 2020-01-17
is on chip #12. The reponse of this chip is lower. The non-linearity
is based on a flat series with the DIT=40sec as the brightest flat in
the sequence (before the brightest flat used had an exposure time of DIT=35sec)
but with now a lower dynamic range of 28000 ADU (before it was 31000 ADU).
In additon to that, the gains per channel show a different distribution.
- Before 2018-01 the qc_line_medmin and qc_line_medmax contain the
counts in the lowest exposure and the counts in the longest exposure flats
generated by the template. Furthermore qc_dit_min and qc_dit_max contain
the exposure times of the shortest and longest exposure. After 2018-01
qc_line_medmin and qc_line_medmax contain the counts in the lowest and
highest exposure flat not rejected by the recipe and used to construct
the polynomial fit of the detector non-linearity. Furthermore qc_dit_min
and qc_dit_max contain the lowest and highest exposure times of these
non-rejected flats. These parameters reflect after 2018-01 the dynamic
range of which the non-linearity is based on.
- The flat images (also the flats of the dome flat template and the gain
calibrations) show a long-term degrading of the received counts,
probably caused by settled dust, the aging of the lamp, of the optical
coating, or of the dome screen reflectivity. As
a side effect, previously excluded flats of a certain longer exposure
time - they were too bright for the non-linearity analysis -, show now
less counts and are included for the analysis, resulting in a different
non-linearity correction, as the dynamic range for the detector used is
now larger. In 2018-03 chips #5 and #6 are affected. The dynamic range
increased for chip #5 from 19700 ADU (DIT = 25sec) to 23000 ADU (DIT =
30sec) and for chip #6 from 22300 ADU (DIT = 25sec) to 25200 ADU (DIT
= 30sec). The impact on the non-linearity correction at 10000 ADU is
negligible for chip #5 and increased from 3% to 4% for chip #6 (averaged
over 16 channels).
- From 2018-07-13 on, the flats with DIT=30sec are acquired with
DIT=32sec to be rejected by the recipe and to provide a non-linearity
correction calibration product MASTER_CHANNEL_TABLE which is no longer
dependent on the fluctuating rejection/acceptance of the brightest
flat.
- On 2018-08-07, M1 and VIRCAM entrance window was cleaned resulting in an increase of counts by about 11% which impacts the choice of brightest flat used.
Algorithm Counts in brightest flat
The qc_line_medmax is the median counts of the brightest dome flat not rejected by the pipeline recipe
Saturation
Each detector has a different saturation level. The saturation levels in ADU as used as an upper rejection threshold by the pipeline are (2009-09):
| chip13 |
chip 14 |
chip 15 |
chip 16 |
| 33000 |
35000 |
34000 |
34000 |
| chip 9 |
chip 10 |
chip 11 |
chip 12 |
| 35000 |
35000 |
37000 |
34000 |
| chip 5 |
chip 6 |
chip 7 |
chip 8 |
| 24000 |
36000 |
35000 |
33000 |
| chip 1 |
chip 2 |
chip 3 |
chip 4 |
| 33000 |
32000 |
33000 |
32000 |
Detector #5 has the lowest saturation level
From 2009-11-20 on, ( after the video channel card replacement for chip #6) the saturation levels used are:
| chip13 |
chip 14 |
chip 15 |
chip 16 |
| 33000 |
35000 |
34000 |
34000 |
| chip 9 |
chip 10 |
chip 11 |
chip 12 |
| 35000 |
35000 |
37000 |
34000 |
| chip 5 |
chip 6 |
chip 7 |
chip 8 |
| 24000 |
27000 |
35000 |
33000 |
| chip 1 |
chip 2 |
chip 3 |
chip 4 |
| 33000 |
32000 |
33000 |
32000 |
In 2018-12 a linearity sequence with longer exposure times was acquired, from which the following real saturation levels
wre derived.
| chip13 |
chip 14 |
chip 15 |
chip 16 |
| > 39600 |
39200 |
36900 |
40200 |
| chip 9 |
chip 10 |
chip 11 |
chip 12 |
| 39000 |
36800 |
39000 |
36300 |
| chip 5 |
chip 6 |
chip 7 |
chip 8 |
| 30800 |
30900 |
36200 |
38000 |
| chip 1 |
chip 2 |
chip 3 |
chip 4 |
| 34500 |
37500 |
37800 |
37300 |
Detector persistence
Trending
The detector persistence was once determined at begin of operations. It is not monitored
Scoring&thresholds Detector persistence
None
History
None
Algorithm Detector persistence
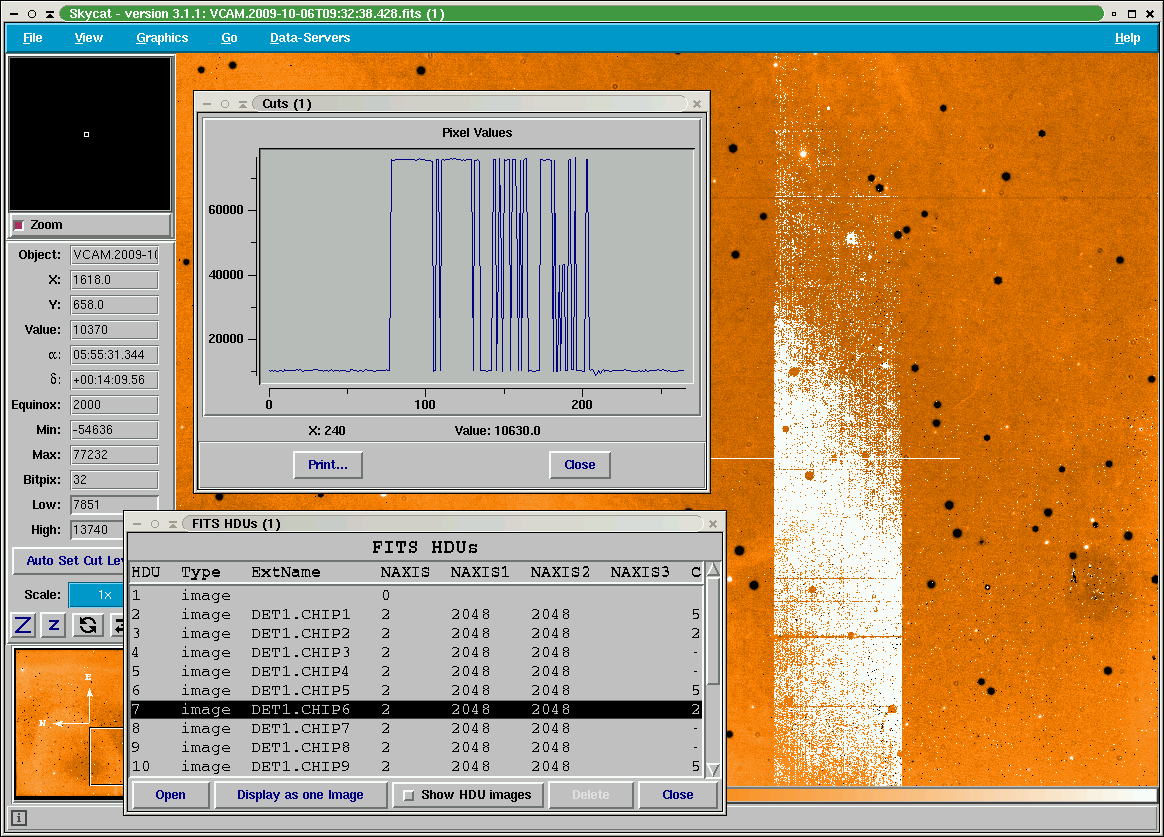
On 2010-05-12, the detector persistence was tested. First five dome flats
were taken with DIT=8 sec to measure the flux in ADU/sec and thereafter
5 dome flats with DIT = 80 sec were taken, which results in nominal flux
of about 400000 ADU. Thereafter 12 dark frames with DIT = 300 sec were
taken to measure the persistence and its decay. The reference dark level
that has been subtracted from the measured persistence was retrieved
from a dark taken 8 hours later. In the log-ADU versus log-time diagram
the decay looks like a straight line, hence the persistence is fit by
the arithmetic function (t in sec):
P(t) = a * t ^{-m}
The best fit parameters a and m are given for the decay sequence in
following table, together with the counts for the extrapolated lamp
flux f. For the fit of the decay, the first data point acquired after
4 minutes has been excluded from the fit, as it deviates from the trend
of all other measurements taken after ~9 min of the saturation.
| D | f/ADU | a / [ADU/sec] | m |
| 1 | 460260 | 30 | -0.77 |
| 2 | 283510 | 27 | -0.74 |
| 3 | 326020 | 100 | -0.87 |
| 4 | 371620 | 60 | -0.90 |
| 5 | 380410 | 112 | -1.02 |
| 6 | 430810 | 135 | -1.02 |
| 7 | 413130 | 283 | -1.10 |
| 8 | 346750 | 189 | -1.05 |
| 9 | 359700 | 243 | -1.11 |
| 10 | 376500 | 236 | -1.15 |
| 11 | 351710 | 250 | -1.13 |
| 12 | 384880 | 540 | -1.18 |
| 13 | 282690 | 10902 | -1.70 |
| 14 | 372010 | 129 | -1.09 |
| 15 | 428480 | 203 | -1.13 |
| 16 | 323570 | 46 | -1.10 |
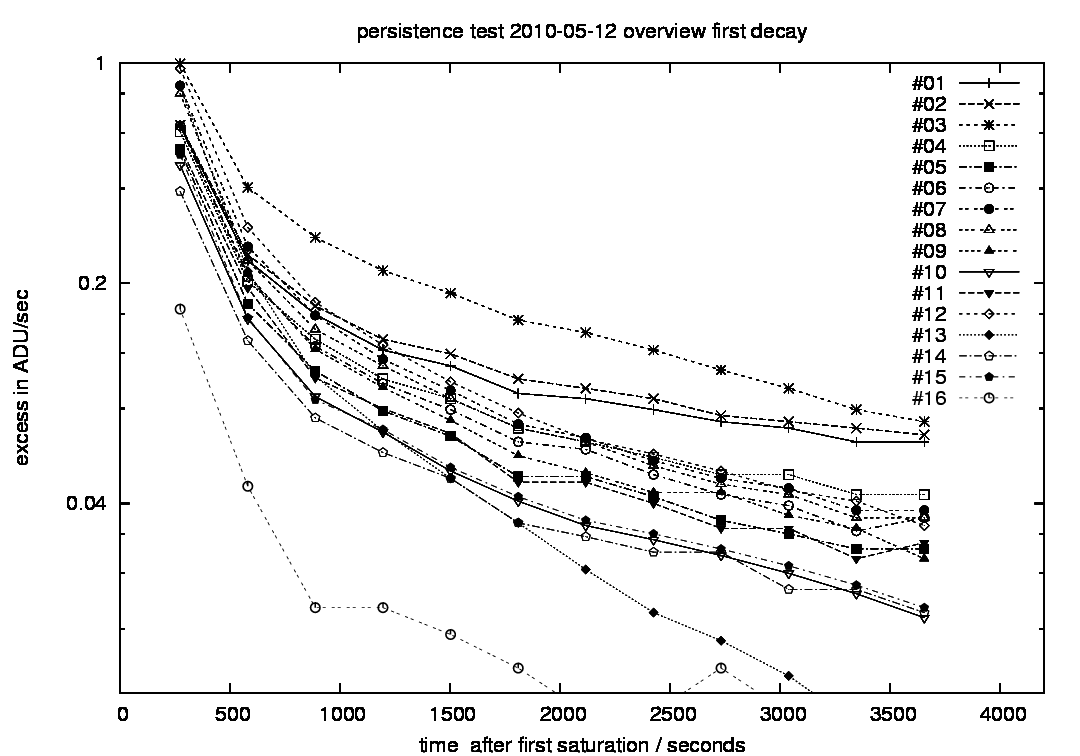 |
Measured persistence P(t) of all 16 detectors in ADU/sec.
|
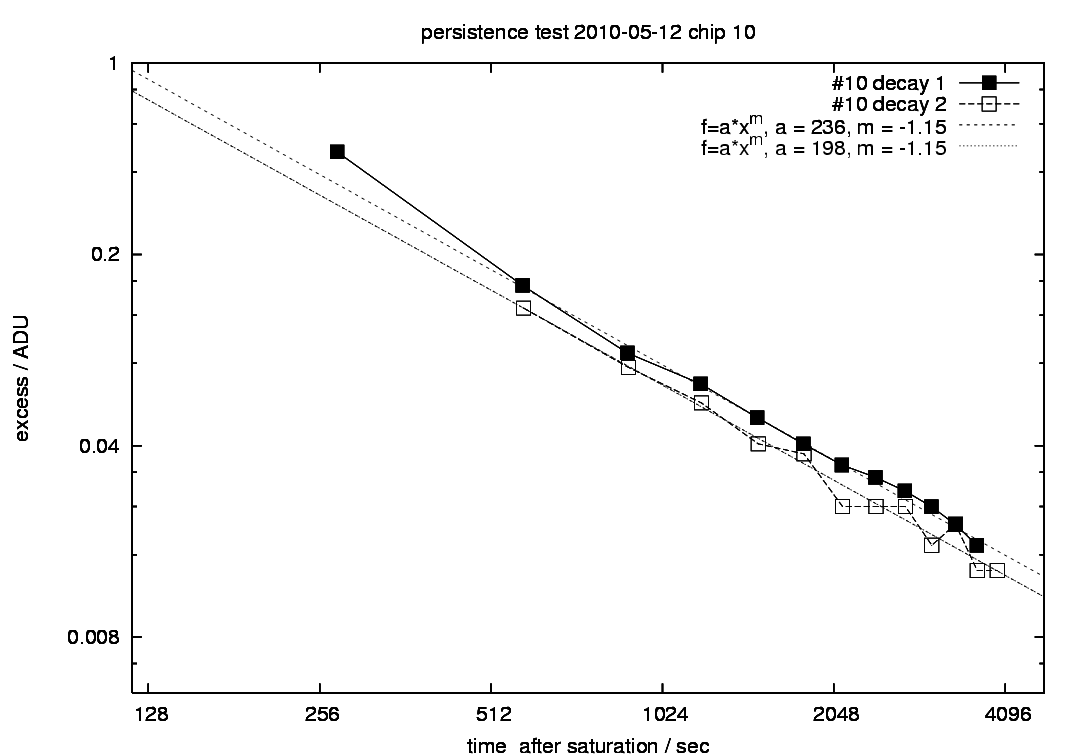 |
Measured persistence of detector #10 for two stimulus events and best fit and best fit parameters a and m. Best fit results of the first decay (filled squares) are given in the table.
|
controller issues
The 16 VIRCAM detectors are operated by two detector controllers (hard- and software),
of which the controller for chips #9 - #16 can impact the read out images in several ways:
If the effect shows up (very rarely) in calibrations, the frames are discarded and the OB might be repeated.
- Detectors might be swapped in the sense that the fits extension #9 claims in its header containing the
pixel from detector #9 but instead contains the pixel of detector #10, while the order of the fits extension headers remain unchanged.
- Fits extensions for a certain chip might contain the pixel data of two distinct chips partly co-added.
- Images might show a jump in the background, that e.g. the upper part of the image might originate from another
detector than the lower part.
- Images might be contaminated by an additional column wise erratic signal. This additional erratic noise
shows up in most but not all affected observations. It can show up also as a standaline symptome.
In 2020-01, the controller blades have been exchanged several times. Since 2020-01-17 VIRCAM is operated with a stable
controller configuration. Since that time channel #16 of chip #15 shows additional noise.
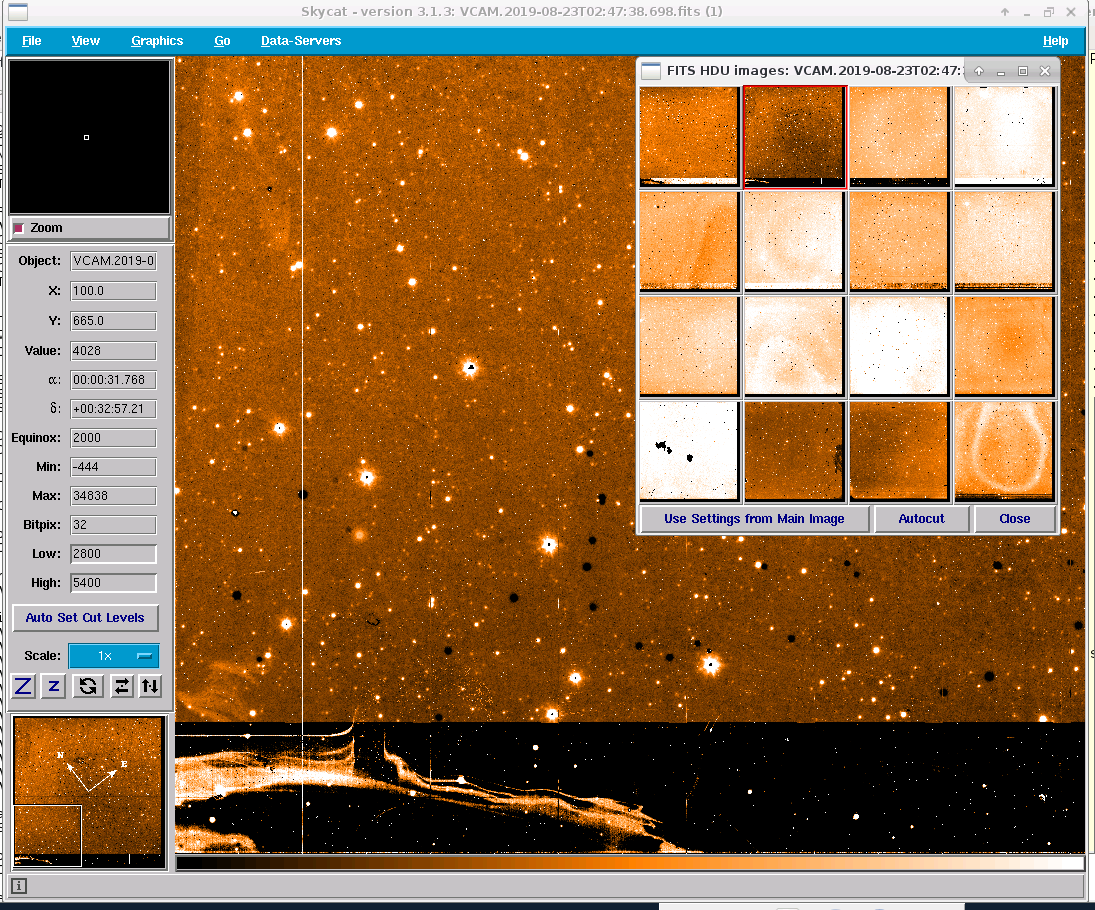 |
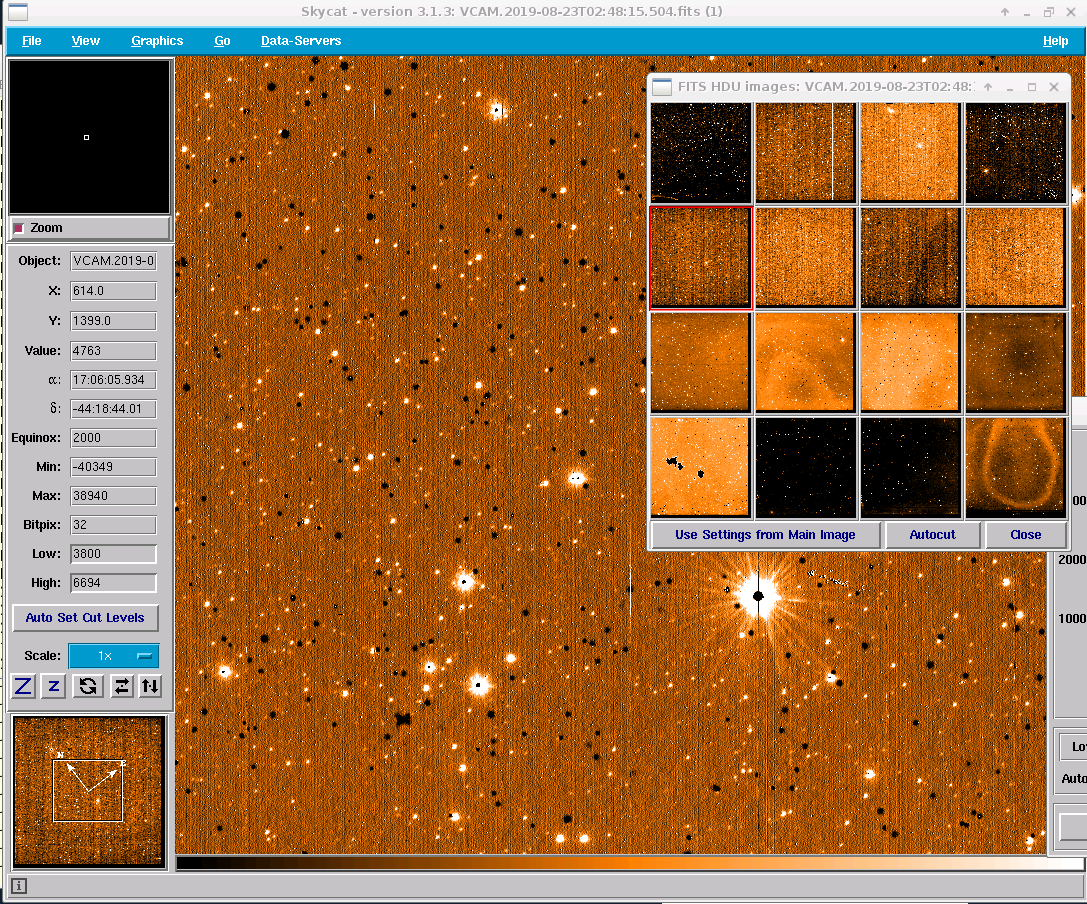
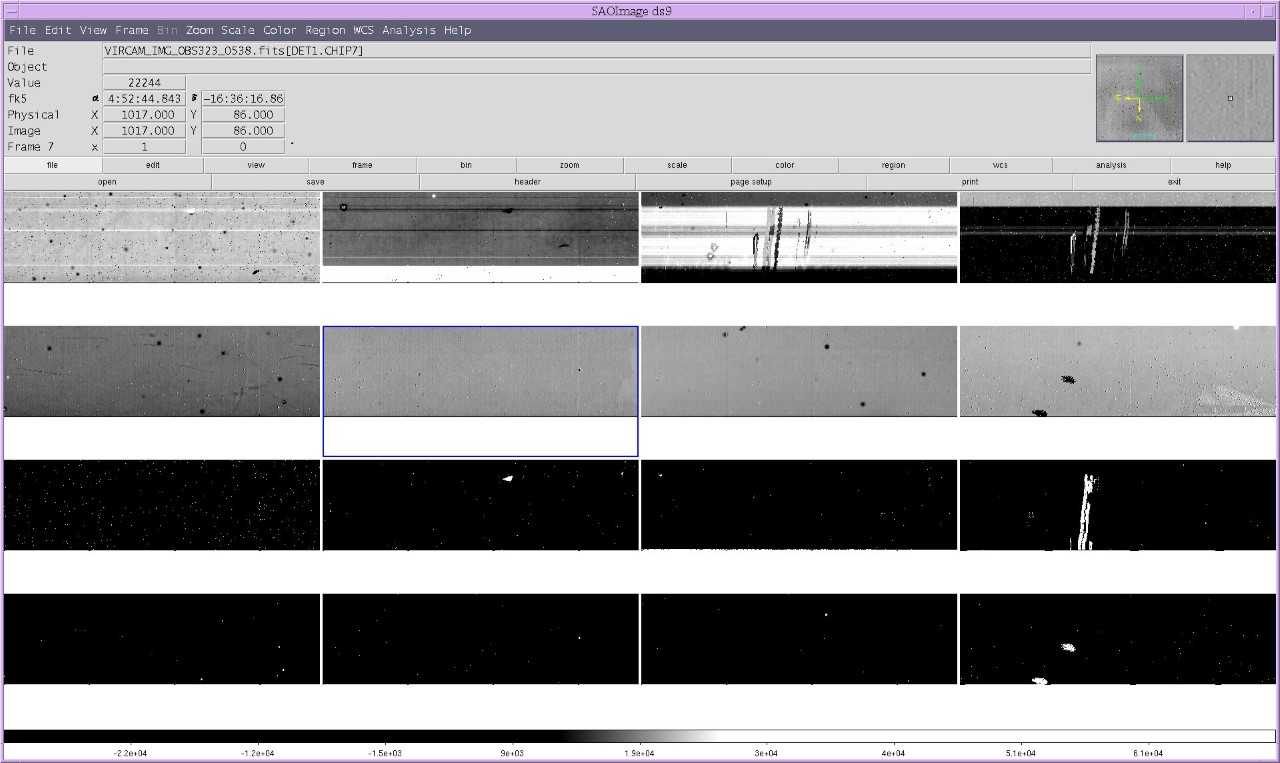
In VIRCAM (and in this skycat display) the 16 chips are numbered from lower left to upper righti.
(e.g. left chip in bottom row is #1, right chip in bottom row is #4, left chip in top row is #13).
All images show one detector on the main display and a mosaic of all 16 detectors on the right.
The lower part of chips #9 - #16 show a different background value.
|
 |
There is a striking column-to-column erratic signal superimposed on the acquired image
in chips #9 - #16.
|
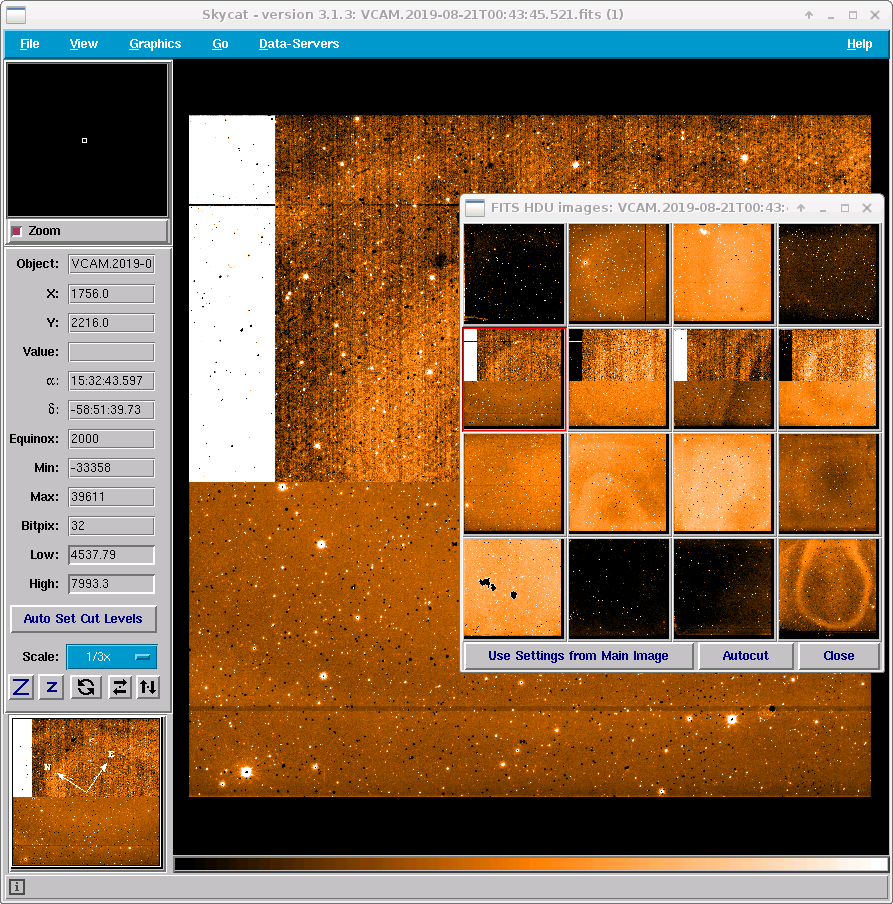 |
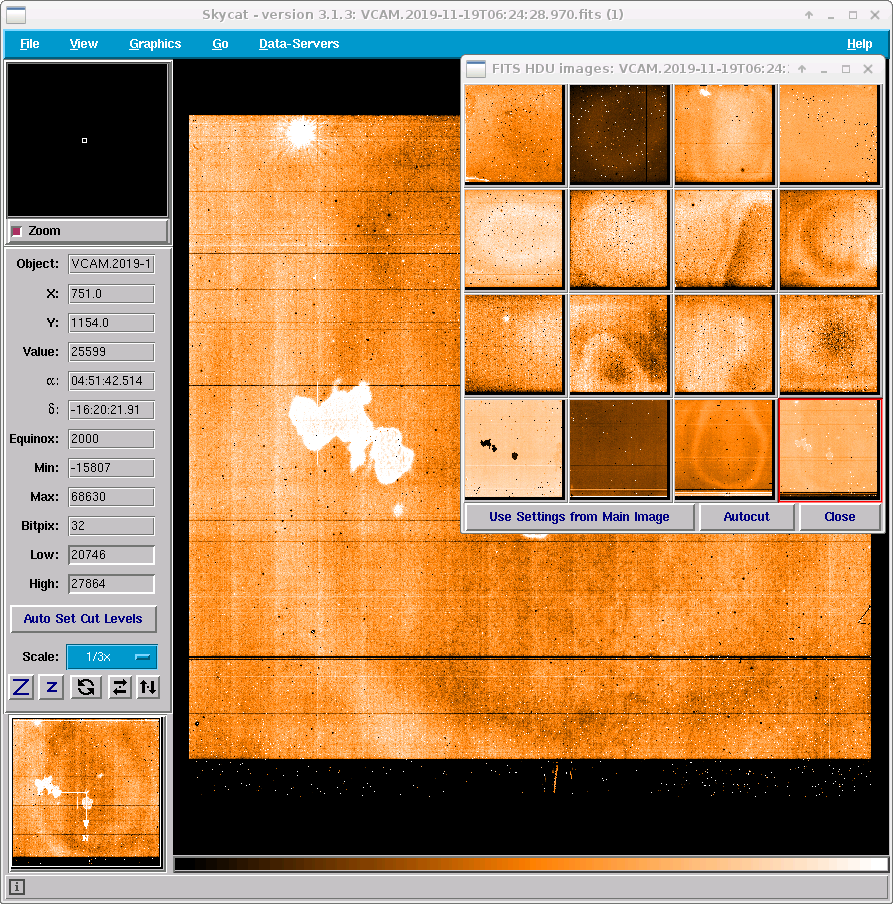
Only chips #9 - #12 are affected: column-two-column erratic signal and composed of three distinct signal sources.
|
 |
Between 2019-11-15 and 2019-11-30 both detector controllers were swapped to test if the issue moves with the
controller and affects chips #1 - #8. It moved with the controller, and in this short period the controller issue
showed up in the lower eight chips. In this example the bad pixel region of chip #1 shows up as a 'shadow' in chip #4.
|
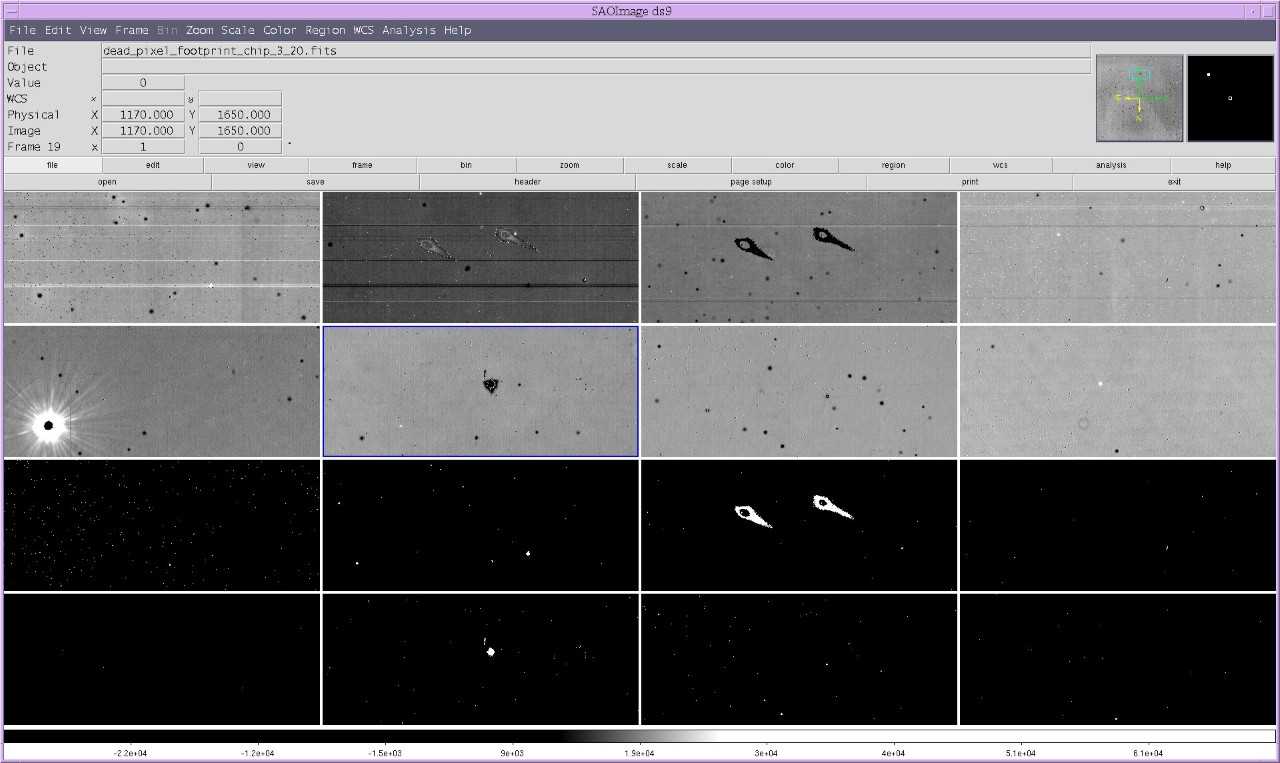 |
These iamges are taken on Nov 18 2019, when the problematic controller was swapped to control chips #1-#8. In VIRCAM (and in this ds9 display) The first 8 chips are numbered from upper left to lower right. The lower eight panels show the
corresponding bad pixel map.
The zoomed view example shows the striking bad pixel features showing up correctly in chip #3 and in its corresponding bad pixel mask, while the imprinted negative in chip #2
does not show up in the bad pixel map for chip #2.
Some of the horizontal bright bars in chip #1 are repeated as negatives in chip #2.
|
 |
Striking bad pixel areas of chip #4 are repeated as negative imprints in chip #3.
The static bad pixel map of chips #1-#8 is shown in the lower eight panels and can serve as a reference.
|
Trending
Not trended
Scoring&thresholds controller issues
None
History
None
Algorithm controller issues
None
detcheck calibrations
The weekly acquired VIRCAM detector linearity template generates
- a set of (regular) dome flats pairs with increasing and decreasing exposure time.
- a set of dark frames with the same sequence of increasing and decreasing exposure times,
used to be subtracted from the dome flats.
- a set of dome flats (so-called DETCHECK flats) with a constant exposure time of 5 sec, interleaved between the
regular dome flats, to be used to monitor the stability of the flux of the dome flat lamps.
The vircam linearity pipeline recipe makes use of the DETCHECK calibration frames when calculating the QC.SCREEN_TOTAL and the QC.SCREEN_STEP parameters.
For this study, we retrieve for every template execution the median counts from all DETCHECK flats frames, resolved per detector and within a detector
revolved per read channel. For each of the 16 (detectors) times 16 (read out channel) time series, we normalize the counts
by the counts in the last acquired exposure.
For chip #16, the analyse is confined to the lower half.
For any time series, we find two effects:
- The normalized counts in the time sequence follow the counts in the regular dome flats
with an amplitude of smaller than 1%. We interpret this feature as
persistence caused by the exposure of the preceeding exposure of the
regular dome flat. Since the regular dome flat sequence is increasing and
decreasing nearly linearly in time, we model this effect by b * |
x - c |, where c is the time in minutes of the largest persistence
and b is the relative amount of persistence in counts.
- The normalized counts in the sequence starts with lower numbers. We
interpret this effect as caused by the lamp itself, due to a residual lamp
warming up effect. We model this behaviour with a - exp(-e * (x-d))
, where d (usually negative) is the lamp ignition time in minutes,
e is related to the lamp warm-up time and a is a value close to 1.
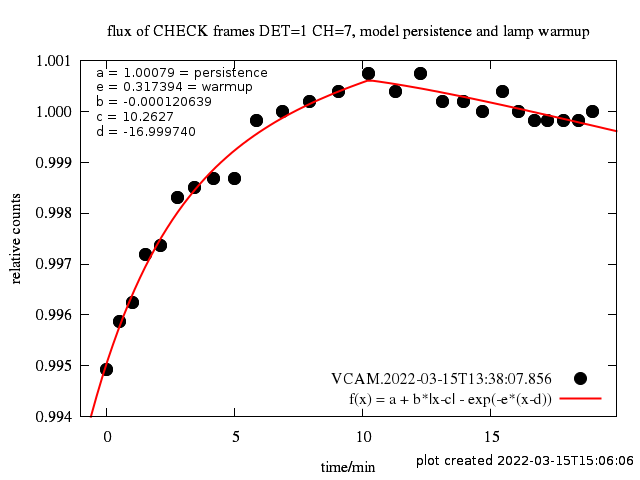 |
Black points: Time sequence of counts in DETCHECK calibrations, normalized to the last exposure for detector #1 and channel #7.
Red line: best fit model. The persistence in chip #1 is low. The lamp warmup effect is dominant.
|
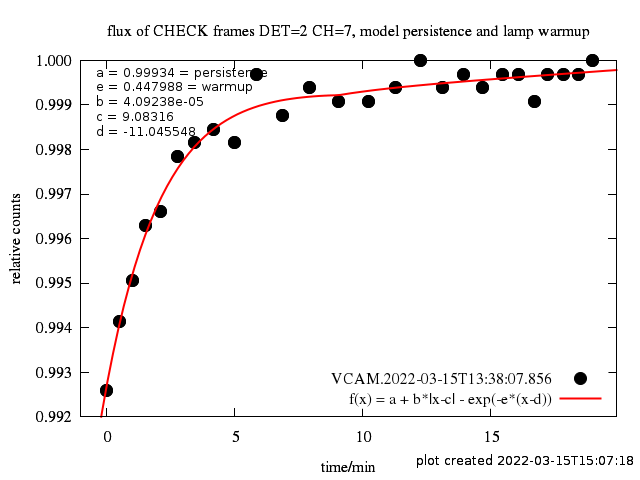 |
As above, but for detector #2. There is no persistence in chip #2. Only the warmup effect is present.
|
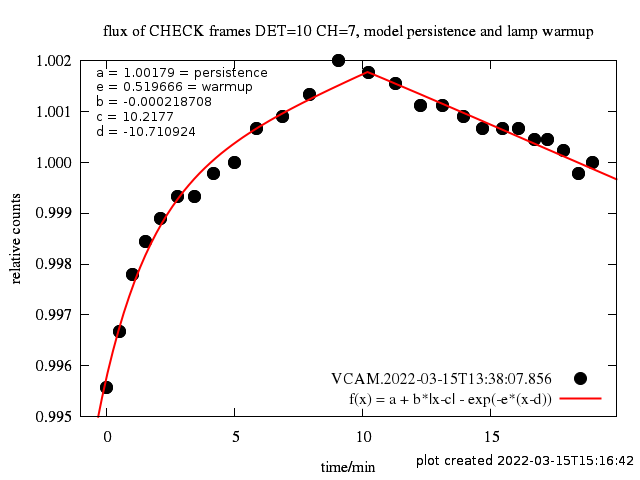 |
As above, but for detector #10.
Both effects are equally develeped.
|
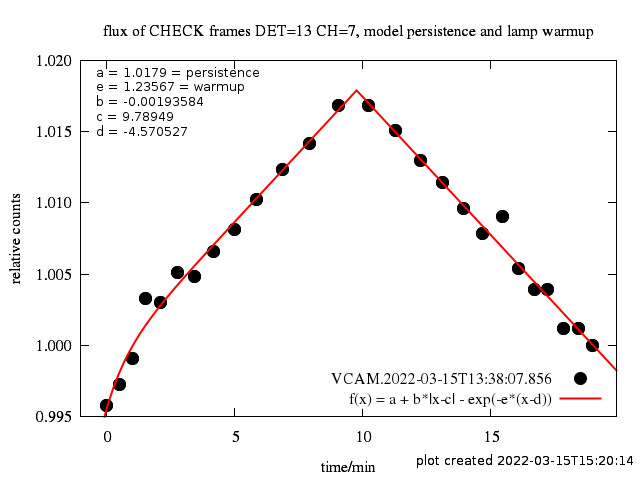 |
As above, but for detector #13.
The peristence is dominant. The warmup effect is negligible.
|
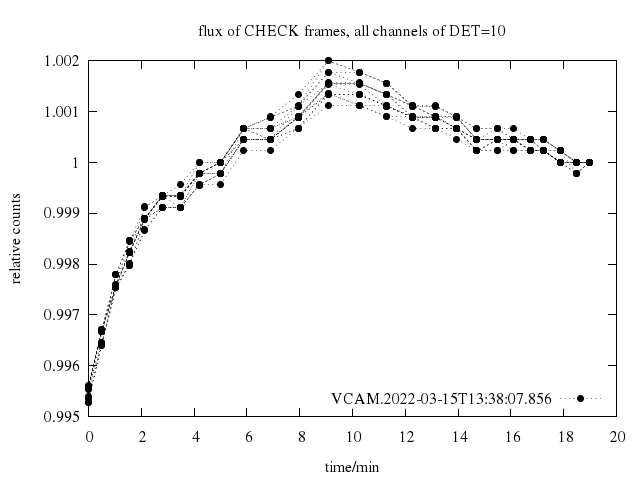 |
Time sequence of counts in DETCHECK calibrations, normalized to the last exposure for all 16 channels of detector #10.
|
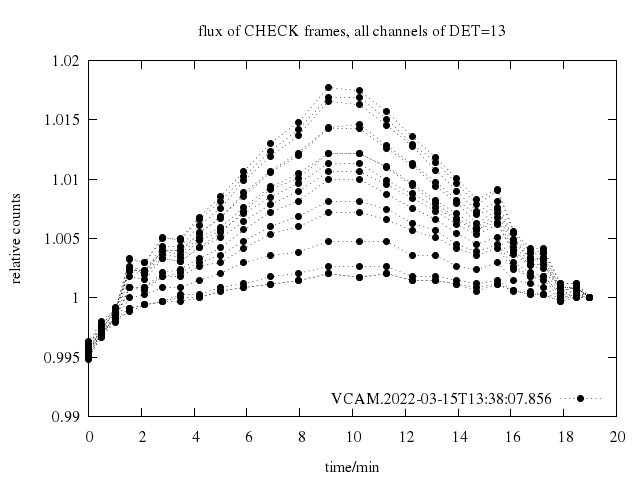 |
Time sequence of counts in DETCHECK calibrations, normalized to the last exposure for all 16 channels of detector #13.
|
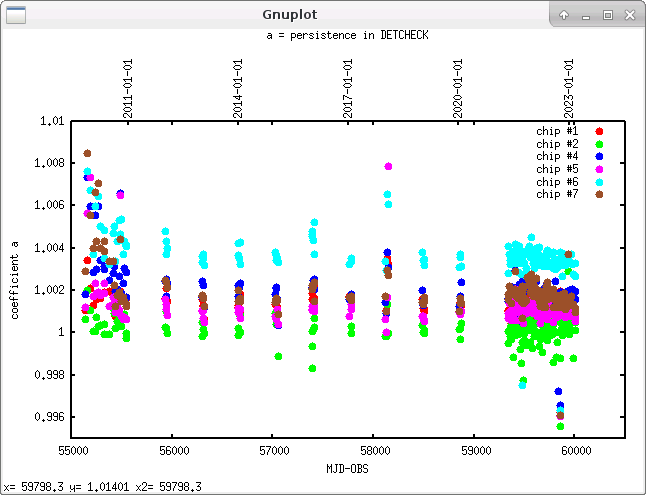 |
Evolution of parameter a from a + b * | x - c | - exp(-e * (x-d)) measuring the persistence during the lifetime of the instrument for several detectors in their channel #7 only.
|
|
Evolution of parameter a from a + b * | x - c | - exp(-e * (x-d)) measuring the persistence during the lifetime of the instrument for several detectors in their channel #7 only.
|
 |
Evolution of parameter a from a + b * | x - c | - exp(-e * (x-d)) measuring the persistence during the lifetime of the instrument for several detectors in their channel #7 only.
|
Trending
Spot checks show that the peristence is stable over the lifetime of the instrument.
Scoring&thresholds detcheck calibrations
None
History
None
Algorithm detcheck calibrations
None
|

