Quality Control and
Data Processing
|
VIRCAM: Quality of twilight flats
The vircam calibration plan includes twilight flats to calibrate science exposures. The derived QC parameters measure operational properties, e.g. if the covered flux range is optimal, or heavily underexposed. No instrument specific property is monitored.  RMS of master twilight flat
The rms of the master flat is monitored for all filters: NB118, NB980, Y, Z, J, H ,K separately. The K-band is monitored here. Scoring&thresholds RMS of master twilight flat There is no scoring. No remarks. Algorithm RMS of master twilight flat The QC.FLATRMS is a measure of RMS in ADU obtained from master twilight flat products. It is the median of the absolute deviations from the median ( = MAD ) times 1.48 derived from the master twilight flat.
RMS of ratio flat
The vircam twilight flat pipeline recipe allows to specify a reference flat, which can be any master flat. The pipeline divides the master flat by the submitted reference flat and extracts some QC parameters of which the RMS of the ratio flat is the most important. The pixel-to-pixel relative response differences (= the fixed pattern noise), which dominate the RMS of the master flat, are canceled out in the ratio flat. The RMS of the ratio flat is therefore sensitive to other changes in the master flat, like:
The RMS of the ratio twilight flat is monitored here. Scoring&thresholds RMS of ratio flat The values are not scored The maintenance of the reference flat means it has to be updated from time to time, typically twice a year and after interventions. The twilight flat QC1 DB contains the name of the reference twilight flat (qc_twflat_refname) and the time stamp of the reference twilight flat (qc_twflat_refdate). The master flat is divided by the reference flat, the RMS is taken.
Minmax of twilight flat series
The counts in the faintest flat is monitored as red diamond symbols, the counts in the brightest flats is monitored as black square symbols. The qc_twflat_medavg is monitored in the same plot as green circles. Due to the different responses per detector, the detector with lowest response of the brightest raw flat can show less counts that the highest response detector of the faintest raw flat. The counts range of the raw flat sequence is monitored here. The counts in the brightest flat can be divided by the DET.SATLEVEL to check how close the counts of brightest flat are at the saturation level. The values are scored for the individual, but there is not trending plot provided, as being a pure product quality and not an instrumental property. In case raw flats are rejected by the pipeline recipe because being too bright or too faint, the master flat of that chip is composed of a lower number of raw flats, which is expressed by the PRO.DATANCOM key. This value is scored on the product level, but there is no trending plot provided. Scoring&thresholds Minmax of twilight flat series The values are not scored. No remarks. Algorithm Minmax of twilight flat series min,max,avg,range: The counts of the twilight flat raw frames vary as the sky brightness varies during dusk or dawn. For each raw frame the median counts is taken. Out of this sample of raw frame medians the minimum, the maximum, the average, the standard deviation and the range is extracted. fracsat: Among all median flux values obtained from the raw fats, the highest flux value is multiplied by (MINDIT+DIT) / DIT to get the flux value on the chip before the detector reset was subtracted by the acquisition system. The value is compared with the saturation level. Details are given on the problems page.
Each detector has its own response. Therefore twilight flats and dome flats show the following relative count rates:
chip #1 and #13 showing the smallest response and chip #1 and #7 showing the largest response. Although the response of chip #5 is close to the array average, it is the first to saturate because of its low saturation level.
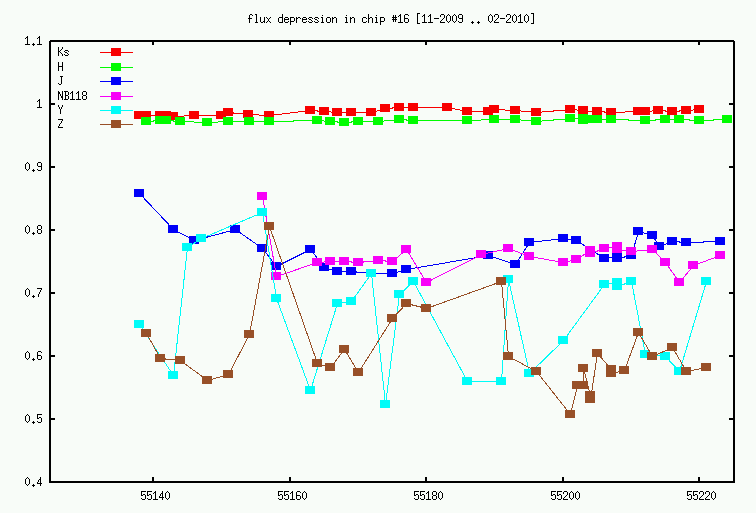
Chip #16 depression
The upper part of detector #16 shows the following effect when being illuminated:
The depression of the upper part of detector #16 is monitored for all filters. Scoring&thresholds Chip #16 depression The parameter is not scored. No remarks. Using the (normalized) master twilight flat, the median counts in the following window is given: xmin=1 ymin=1500 xmax=2048 ymax=2048 , which covers almost the upper part of the detector. Setup: INS.FILT1.NAME = Ks (2.15), H (1.65), J (1.25), NB118 (1.185), Y (1.02) NB980 (0.98), Z (0.88) As the upper region of detector #16 shows a rather fractal pattern, the minimum counts in the analyzed region are much less than the median value monitored.The purpose of the plot is to monitor the unpredictable variations in the blue bands.
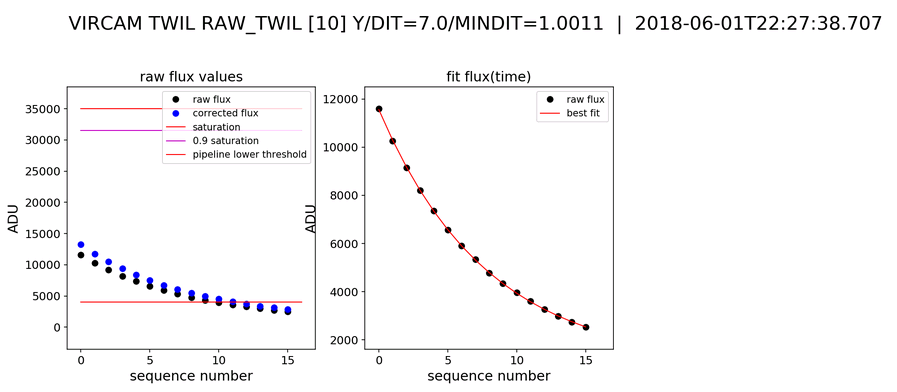
Twilight cirrus
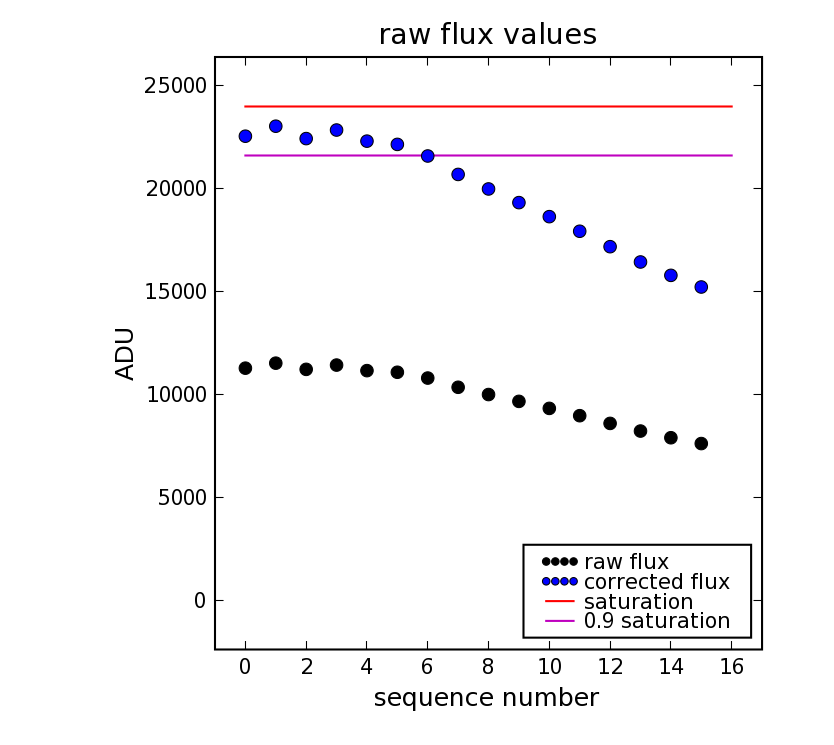
The cirrus parameter is monitored Scoring&thresholds Twilight cirrus This parameter is not scored In 2019-01 two cases were found where one of the raw frames of the sequence showed in several but not all detectors a controller issue (an unillumnated image with a peculiar fixed patter noise). The inclusion of the fake raw frame cannot be detected in the QC parameters extracted from the master twilight flat. Only the cirrus parameter is sensitive to these events. Controller issues can show up in cases of high ambient temperature. Under photometric and clear conditions the sky brightness is (de)inreases during (dusk)dawn in a continuous manner. Thin or thick cirrus moving through the FOV disturb the continuous flux trend. The function flux(time)= A + B * exp ( - C * (D - time)) is fit to the raw flux sequence and the RMS of the fit is considered as a measure of the sky brightness continuity within the FOV. The CirrusTest parameter is the RMS of the exponential fit to fluxes retrieved from the twilight flat raw frames. It is a quality parameter of the master twilight flat. 2009-10-3 ... 2009-11-03: twilight flat saturationThe acquisition of photons by near infrared detectors consists of an initial reset, a first non-destructive read out followed by one or more further reads. The signal recorded between the reset and the first read is subtracted by the acquisition system before being written to file. The time between the reset and the first read amounts to 1.0011 sec and is called the minimum possible DIT (= MINDIT). The time between the first and the final read is called DIT. The fits frame contains the counts accumulated within DIT seconds, but the pixels on the detector hosted more counts accumulated within DIT + MINDIT seconds and might saturate the chip. This internal saturation can occur for high fluxes and when a DIT of the order of MINDIT is used. This effect occurred for a number of raw twilight flats in some periods during the commissioning (2008-10-01 - 2009-10-25), science verification (2009-10-15 - 2009-11-03) and dry runs (2009-11-04 - 2010-02-15). Assuming linear response the signal on the detector before reset subtraction can be estimated : counts[detector] = counts[rawframe] * ( MINDIT + DIT ) / DIT The counts[detector] values are monitored for twilight flats. The maximum values within a raw frame stack is given in units of the individual detector saturation level by the dimensionless QC1 parameter qc_twflat_fracsat. The values are scored.
|
||||||||||||||||||||||||||||||||||||||||||||||||||||||||||||||||||||||||||||||||||||||||||||||||||||||||||||||||||||||||||||||||||||||||||||||||||||||||||||||||||||||||||||||||||||||||||||||||||||||||||||||||||||||||||||||||||||||||||||||||||||||||||||||||||||||||||||||||||||||||||||||||||||||||||||||||||||||||||||||||||||||||||||||||||||||||||||||||||||||||||||||||||||||||||||||||||||||||||||||||||||||||||||||||||||||||||||||||||||||||||||||||||||||||||||||||||||||||||||||||||||||||||||||||||||||||||||||||||||||||||||||||||||||||||||||||||||||||||||||||||||||||||||||||||||||||||||||||||||||||||||||||||||||||||||||||||||||||||||||||||||||||||||||||||||||||||||||||||||||||||||||||||||||||||||||||||||||||||||||||||||||||||||||||||||||||||||||||||||||||||||||||||||||||||||||||||
| |
|||||||||||||||||||||||||||||||||||||||||||||||||||||||||||||||||||||||||||||||||||||||||||||||||||||||||||||||||||||||||||||||||||||||||||||||||||||||||||||||||||||||||||||||||||||||||||||||||||||||||||||||||||||||||||||||||||||||||||||||||||||||||||||||||||||||||||||||||||||||||||||||||||||||||||||||||||||||||||||||||||||||||||||||||||||||||||||||||||||||||||||||||||||||||||||||||||||||||||||||||||||||||||||||||||||||||||||||||||||||||||||||||||||||||||||||||||||||||||||||||||||||||||||||||||||||||||||||||||||||||||||||||||||||||||||||||||||||||||||||||||||||||||||||||||||||||||||||||||||||||||||||||||||||||||||||||||||||||||||||||||||||||||||||||||||||||||||||||||||||||||||||||||||||||||||||||||||||||||||||||||||||||||||||||||||||||||||||||||||||||||||||||||||||||||||||||||
 |
|
||||||||||||||||||||||||||||||||||||||||||||||||||||||||||||||||||||||||||||||||||||||||||||||||||||||||||||||||||||||||||||||||||||||||||||||||||||||||||||||||||||||||||||||||||||||||||||||||||||||||||||||||||||||||||||||||||||||||||||||||||||||||||||||||||||||||||||||||||||||||||||||||||||||||||||||||||||||||||||||||||||||||||||||||||||||||||||||||||||||||||||||||||||||||||||||||||||||||||||||||||||||||||||||||||||||||||||||||||||||||||||||||||||||||||||||||||||||||||||||||||||||||||||||||||||||||||||||||||||||||||||||||||||||||||||||||||||||||||||||||||||||||||||||||||||||||||||||||||||||||||||||||||||||||||||||||||||||||||||||||||||||||||||||||||||||||||||||||||||||||||||||||||||||||||||||||||||||||||||||||||||||||||||||||||||||||||||||||||||||||||||||||||||||||||||||||||