Plot
? |
Symb
? |
Source
* |
Average ? |
Thresholds ? |
N_
data |
QC1
parameter |
Data
downloads |
Remarks |
| method |
value |
unit |
method |
value |
| 1 |
• | QC1DB |
MEDIAN |
2.64e+03 |
ADU |
VAL | 50,14000 |
1 |
qc_twflat_medrng |
this |
last_yr |
all
|
TWILRAWRANGE, average over all 16 detectors |
| 2 |
• | QC1DB |
MEDIAN |
2.65e+03 |
ADU |
VAL | 50,14000 |
16 |
qc_twflat_medrng |
this |
last_yr |
all
|
TWILRAWRANGE, values of all detetcors |
| 3 |
• | QC1DB |
MEDIAN |
390 |
ADU |
VAL | 10,2000 |
1 |
qc_twflat_medrng |
this |
last_yr |
all
|
TWILRAWRANGE, stdev over all detectors |
| |
|
*Data sources: QC1DB: QC1 database; LOCAL: local data source
|
Plot 1
scores: not implemented
| | data source: | vircam_twilight
(QC1 database) |
| dataset: | qc_twflat_medrng | • |
| median: | 2.64e+03 | ADU |
| fixed thresholds: | 50...14000 | ADU |
| N_data plotted: | 1 |
| [click plot for closeup] |
Plot 2
scores: not implemented
| | data source: | vircam_twilight
(QC1 database) |
| dataset: | qc_twflat_medrng | • |
| median: | 2.65e+03 | ADU |
| fixed thresholds: | 50...14000 | ADU |
| N_data plotted: | 16 |
| [click plot for closeup] |
Plot 3
scores: not implemented
| | data source: | vircam_twilight
(QC1 database) |
| dataset: | qc_twflat_medrng | • |
| median: | 390 | ADU |
| fixed thresholds: | 10...2000 | ADU |
| N_data plotted: | 1 |
| [click plot for closeup] |
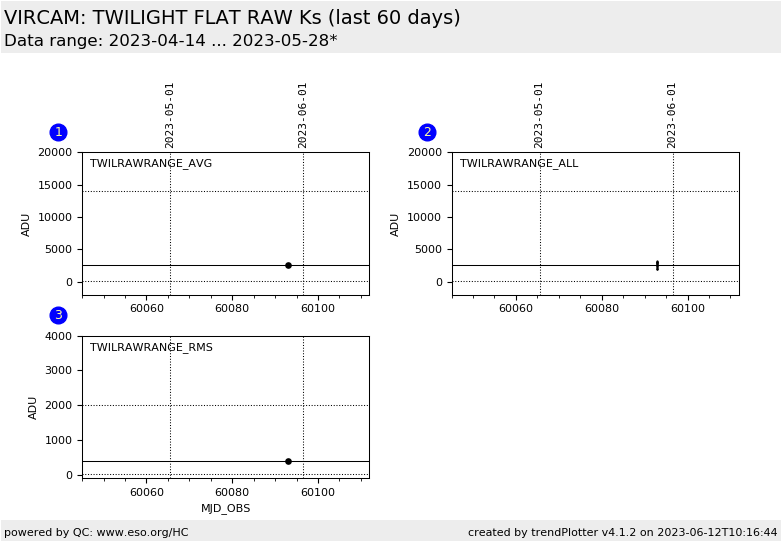
Trending plot for Range of raw frame medians.
QC parameters is derived from the raw frame input stack.
Name:QC_RAWMED_RANGE
Fits header: QC.FLATRNG,
QC1 DB: qc_twflat_medrng
Description:
Retrieve from each raw frame the median of the flux level. Take the range of all raw frame medians.
Setup:
INS.FILT1.NAME = Ks
These plots describe:
Fig. 1. Average view: The QC parameter averaged over all detectors.
This view is sensitive to common changes.
Fig. 2. Resolved View: The QC parameter resolved for all detectors.
Fig. 3. Scatter View: The standard deviation of the QC parameter, obtained from the sample of all detectors.
This view is sensitive changes of individual detectors.
Fig. 4. Scoring View: Scoring values of all 16 QC parameters.
Green = within the acceptance thresholds.
Red = beyond the acceptance thresholds.
Find more information on the VIRCAM TWILIGHT FLAT tutorial page.
General information
Click on any of the plots to see a close-up version.
The latest date is indicated on top of the plot.
If configured,
- data points belonging to the latest date are specially marked
- statistical averages are indicated by a solid line, and thresholds by broken lines
- outliers are marked by a red asterisk. They are defined as data points outside the
threshold lines
- "aliens" (= data points outside the plot Y limits) are marked by a red arrow (↑ or ↓)
- you can download the data for each parameter set if the 'Data downloads' link shows up
|
