mirror sites: PL HQ

Health Check monitor


CAL | HC | refs | QC
HealthCheck Monitor
   HOME | UsersGuide
  sl icon ALL INSTRUMENTS
VISIR:
detectors
Other HC:
QC links:
        [page auto-refreshes after 300 sec]   [stop | on]            [press Ctrl+R to enforce refresh of scores and dates]
VISIR trending system: HEALTH CHECK report
Last update: 2012-05-14T13:45:23 (UT)
| now: 2012-05-24T23:04:51 (UT)
HELP USERS-GUIDE MORE
same group: read-noise read-noise12 dark flat-flux nbadpix det-temp
General news: 2012-05-24: The HC monitors for OMEGACAM, VIRCAM and HAWKI are back. Population with current data is in progress.
VISIR news: 2012-05-09: VISIR upgrade began; instrument is scheduled back in operations on Sep.9th, 2012
Report news:  
DATE*: [?] 2012-05-17
no data | NR
2012-05-18
no data | NR
2012-05-19
no data | NR
2012-05-20
no data | NR
2012-05-21
no data | NR
2012-05-22
no data | NR
2012-05-23
no data | NR
2012-05-24
no data | NR
P...
Product quality:
no products no products no products no products no products no products no products no products
  no OPSLOG data  

scores&comments | history ... | plot tutorial ... | contact                 daily/often; important to check     [?]
*Date on this monitor changes at 21:00 UT
Print: Information and research:
- png file - advanced studies: QC1 browser | QC1 plotter
Plot
?
Symb
?
Source
*
OPS?
**
Average ? Thresholds ? N_
data
QC1
parameter
Data
downloads
Remarks
method value unit method value
1 QC1DB no MEAN 182009.17188   VAL174000,198000 83 lamp_flux this | last_yr | all mean difference flux - imaging detector
*Data sources: QC1DB: QC1 database; LOCAL: local text file | **OPS: to indicate that OPSLOG data are included
Plot 1
scores: 2|
data source:visir_flat_img
(QC1 database)
dataset:lamp_flux
mean:182009.17188 
fixed thresholds:174000.0...198000.0 
N_data plotted:83
[click on plot for closeup]
This plot

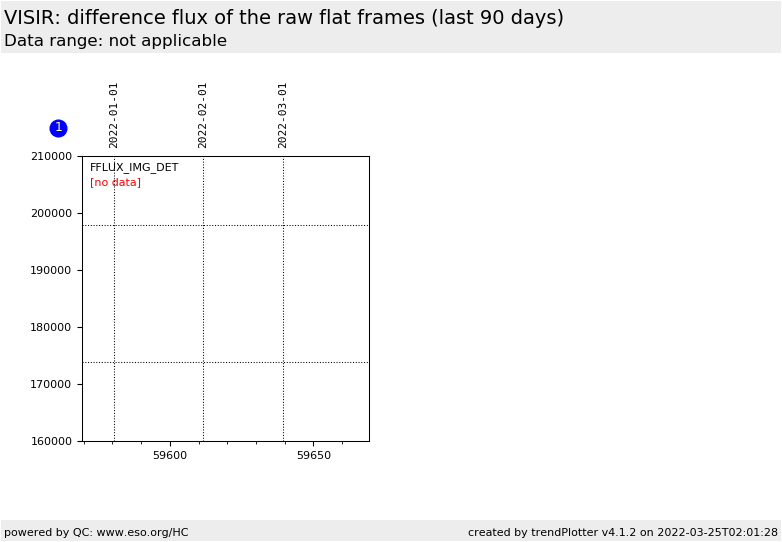
This is a trending plot monitoring the stability of the VISIR WCU. The "lamp_flat" parameter is calculated by the pipeline from the raw flat field frames. The two first frames in the stack (taken at temp. 20C and 10C of the WCU), are subtracted them from each other, the median flux in the central area is calculated and normalized by DIT. The values are displayed for the imaging detector.  


General information

Click on any of the plots to see a close-up version. The latest date is indicated on top of the plot, data points belonging to that date are specially marked.

If configured,

  • statistical averages are indicated by a solid line, and thresholds by broken lines
  • outliers are marked by a red asterisk. They are defined as data points outside the threshold lines
  • "aliens" (= data points outside the plot Y limits) are marked by a red arrow ( or )
  • you can download the data for each parameter set if the 'Data downloads' link shows up