Plot
? |
Symb
? |
Source
* |
Average ? |
Thresholds ? |
N_
data |
QC1
parameter |
Data
downloads |
Remarks |
| method |
value |
unit |
method |
value |
| 1 |
• | QC1DB |
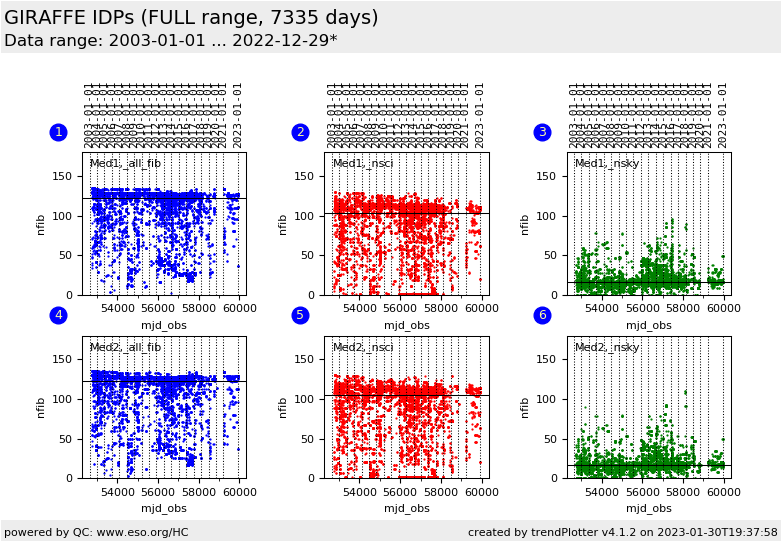
MEDIAN |
122 |
counts |
none | |
9166 |
nfib |
all (full time range)
| Number of fibres used. Medusa1, brightest fibre only, all setups.
1. Total number of fibres |
| 2 |
• | QC1DB |
MEDIAN |
103 |
counts |
none | |
9166 |
nsci |
all (full time range)
| 2. Number of science fibres |
| 3 |
• | QC1DB |
MEDIAN |
16 |
counts |
none | |
9166 |
nsky |
all (full time range)
| 3. Number of sky fibres |
| 4 |
• | QC1DB |
MEDIAN |
123 |
counts |
none | |
8787 |
nfib |
all (full time range)
| Same as plot 1, for Medusa2. 4. All fibres. |
| 5 |
• | QC1DB |
MEDIAN |
105 |
counts |
none | |
8787 |
nsci |
all (full time range)
| 5. Science fibres |
| 6 |
• | QC1DB |
MEDIAN |
16 |
counts |
none | |
8787 |
nsky |
all (full time range)
| 6. Sky fibres |
| |
|
*Data sources: QC1DB: QC1 database; LOCAL: local data source
|
| Plot 1 | | data source: | giraffe_science_public
(QC1 database) |
| dataset: | nfib | • |
| median: | 122 | counts |
| thresholds: | none | |
| N_data plotted: | 9166 |
| [click plot for closeup] |
| Plot 2 | | data source: | giraffe_science_public
(QC1 database) |
| dataset: | nsci | • |
| median: | 103 | counts |
| thresholds: | none | |
| N_data plotted: | 9166 |
| [click plot for closeup] |
| Plot 3 | | data source: | giraffe_science_public
(QC1 database) |
| dataset: | nsky | • |
| median: | 16 | counts |
| thresholds: | none | |
| N_data plotted: | 9166 |
| [click plot for closeup] |
| Plot 4 | | data source: | giraffe_science_public
(QC1 database) |
| dataset: | nfib | • |
| median: | 123 | counts |
| thresholds: | none | |
| N_data plotted: | 8787 |
| [click plot for closeup] |
| Plot 5 | | data source: | giraffe_science_public
(QC1 database) |
| dataset: | nsci | • |
| median: | 105 | counts |
| thresholds: | none | |
| N_data plotted: | 8787 |
| [click plot for closeup] |
| Plot 6 | | data source: | giraffe_science_public
(QC1 database) |
| dataset: | nsky | • |
| median: | 16 | counts |
| thresholds: | none | |
| N_data plotted: | 8787 |
| [click plot for closeup] |
This plot shows the relation between SNR (called 'mean_s2n' in the database) and average counts (not flux, although it is called 'mean_flux') for the GIRAFFE
IDPs. Both parameters measure the quality of the reduction process: the higher
the flux, the higher the SNR if the noise is dominated by photon noise.
In that case a square-root law is expected.
If there are other noise sources (e.g. incomplete removal of gain noise,
fringing, etc.) deviations from the square-root curve should be expected, e.g.
a plateau in the SNR curve for spectra with high counts, or an offset at very
low counts. See the plot tutorial for more.
Note that in the period 2006-2008 these plots indeed show a downward SNR deviation. This was due to
master flats generated with an earlier pipeline version that had a bug in the
error computation for those products. Since the earlier master flats have been
recreated from scratch, with the same pipeline version as the 2008+ ones, the
corresponding IDPs do not have that SNR deficiency. It is spurious anyway, the
IDPs do not suffer from a real SNR degradation.
We have selected the brightest fibre in each exposure for display. For
each data point from the brightest fibre there are on average 50-100 more from fainter fibres. No distinction has been made between Medusa1 and Medusa2 slits. The selection of settings is based on statistics.
Both parameters are averages across the whole spectrum. They depend therefore
somewhat on the slope of the spectra and therefore on the nature of the targets. This
might explain the observed spread in the relations, which however are all
close to square-root laws.
The upper and lower boundaries of the "fan" are scaled square-root laws and
purely empirical. They are plotted for orientation and are not fits.
NOTE: don't try the 'Data downloads', they take very long or even time out.
General information
Click on any of the plots to see a close-up version.
The latest date is indicated on top of the plot.
If configured,
- data points belonging to the latest date are specially marked
- statistical averages are indicated by a solid line, and thresholds by broken lines
- outliers are marked by a red asterisk. They are defined as data points outside the
threshold lines
- "aliens" (= data points outside the plot Y limits) are marked by a red arrow (↑ or ↓)
- you can download the data for each parameter set if the 'Data downloads' link shows up
|
