Plot
? |
Symb
? |
Source
* |
Average ? |
Thresholds ? |
N_
data |
QC1
parameter |
Data
downloads |
Remarks |
| method |
value |
unit |
method |
value |
| 1 |
• | QC1DB |
none |
|
number |
none | |
13 |
num_cosmics |
this |
last_yr |
all
|
1. Low gain, 1x1 bin: STARE mode |
| 1 |
• | QC1DB |
none |
|
number |
none | |
182 |
num_cosmics |
this |
last_yr |
all
|
NODDING |
| 1 |
• | QC1DB |
none |
|
number |
none | |
0 |
num_cosmics |
this |
last_yr |
all
|
OFFSET | |
| 2 |
• | QC1DB |
none |
|
number |
none | |
141 |
num_cosmics |
this |
last_yr |
all
|
2. High gain, 1x1 bin: STARE mode |
| 2 |
• | QC1DB |
none |
|
number |
none | |
104 |
num_cosmics |
this |
last_yr |
all
|
NODDING |
| 2 |
• | QC1DB |
none |
|
number |
none | |
3 |
num_cosmics |
this |
last_yr |
all
|
OFFSET | |
| 3 |
• | QC1DB |
none |
|
number |
none | |
0 |
num_cosmics |
this |
last_yr |
all
|
3. Low gain, 2x2 bin: STARE mode |
| 3 |
• | QC1DB |
none |
|
number |
none | |
15 |
num_cosmics |
this |
last_yr |
all
|
NODDING |
| 3 |
• | QC1DB |
none |
|
number |
none | |
0 |
num_cosmics |
this |
last_yr |
all
|
OFFSET | |
| 4 |
• | QC1DB |
none |
|
number |
none | |
23 |
num_cosmics |
this |
last_yr |
all
|
4. High gain, 2x2 bin: STARE mode |
| 4 |
• | QC1DB |
none |
|
number |
none | |
20 |
num_cosmics |
this |
last_yr |
all
|
NODDING |
| 4 |
• | QC1DB |
none |
|
number |
none | |
11 |
num_cosmics |
this |
last_yr |
all
|
OFFSET |
| |
|
*Data sources: QC1DB: QC1 database; LOCAL: local data source
|
| Plot 1 | | data source: | xshooter_science_idp
(QC1 database) |
dataset:
(numbers below apply to this dataset) | num_cosmics | • |
| average: | none |
| thresholds: | none |
| N_data plotted: | 13 |
| [click plot for closeup] |
| Plot 2 | | data source: | xshooter_science_idp
(QC1 database) |
dataset:
(numbers below apply to this dataset) | num_cosmics | • |
| average: | none |
| thresholds: | none |
| N_data plotted: | 141 |
| [click plot for closeup] |
| Plot 3 | | data source: | xshooter_science_idp
(QC1 database) |
dataset:
(numbers below apply to this dataset) | num_cosmics | • |
| average: | none |
| thresholds: | none |
| N_data plotted: | 0 |
| [click plot for closeup] |
| Plot 4 | | data source: | xshooter_science_idp
(QC1 database) |
dataset:
(numbers below apply to this dataset) | num_cosmics | • |
| average: | none |
| thresholds: | none |
| N_data plotted: | 23 |
| [click plot for closeup] |
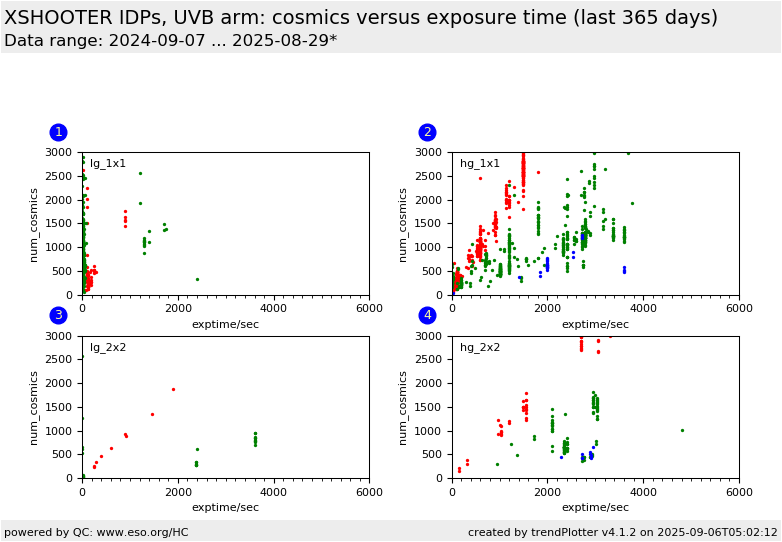
This plot shows the number of cosmic events detected by the pipeline in the science observations as a function of the total exposure time.
For the UVB and VIS arm, we offer correlations for the two values of detector gain (low gain = lg or high gain = hg) and for the two
pixel binnings (1x1 or 2x2).
Datasets split by the different observing techniques:
- red for STARE (single exposure),
- green for NODDING (exposure pairs)
- blue for OFFSET (OBJECT and SKY exposures)
For the STARE mode, the number of cosmics should increase linearly with the exposure time. For NODDING mode, the numbers should be lower because
cosmics tend to be suppressed by stacking.
In the NIR arm, the left box is for the STARE and OFFSET mode observations (including
the mapping template observations).
For the K-band supressing 0.9x11JH slit, the pipeline does not evaluate the
K-band orders resulting in an effective smaller pixel region with respect to
the 0.9x11 slit, and a smaller resulting number of cosmics.
The right box displays the NODDING products, with the
most frequently used values of PRO.DATANCOM (N, the total number of combined raw frames) highlighted.
General information
Click on any of the plots to see a close-up version.
The latest date is indicated on top of the plot.
If configured,
- data points belonging to the latest date are specially marked
- statistical averages are indicated by a solid line, and thresholds by broken lines
- outliers are marked by a red asterisk. They are defined as data points outside the
threshold lines
- "aliens" (= data points outside the plot Y limits) are marked by a red arrow (↑ or ↓)
- you can download the data for each parameter set if the 'Data downloads' link shows up
|
