Plot
? |
Symb
? |
Source
* |
Average ? |
Thresholds ? |
N_
data |
QC1
parameter |
Data
downloads |
Remarks |
| method |
value |
unit |
method |
value |
| 1 |
• | QC1DB |
none |
|
arcsec |
none | |
84 |
psf_fwhm_ifu03 |
this |
last_yr |
all
|
FWHM of PSF, IFU 3 |
| 2 |
• | QC1DB |
none |
|
arcsec |
none | |
0 |
psf_fwhm_ifu12 |
this |
last_yr |
all
|
FWHM of PSF, IFU 12 |
| 3 |
• | QC1DB |
none |
|
arcsec |
none | |
0 |
psf_fwhm_ifu18 |
this |
last_yr |
all
|
FWHM of PSF, IFU 18 |
| 4 |
• | QC1DB |
MEAN |
|
none |
none | |
0 |
psf_fwhm_ifu12 |
|
FWHM of PSF, IFU 12 : IFU 3 |
| 5 |
• | QC1DB |
MEAN |
|
none |
none | |
0 |
psf_fwhm_ifu18 |
|
FWHM of PSF, IFU 18 : IFU 3 |
| 6 |
• | QC1DB |
MEAN |
|
none |
none | |
0 |
psf_fwhm_ifu18 |
|
FWHM of PSF, IFU 18 : IFU 12 |
| |
|
*Data sources: QC1DB: QC1 database; LOCAL: local data source
|
Plot 1
scores: not implemented
| | data source: | kmos_std
(QC1 database) |
| dataset: | psf_fwhm_ifu03 | • |
| average: | none |
| thresholds: | none |
| N_data plotted: | 84 |
| [click plot for closeup] |
Plot 2
scores: not implemented
| | data source: | kmos_std
(QC1 database) |
| dataset: | psf_fwhm_ifu12 | • |
| average: | none |
| thresholds: | none |
| N_data plotted: | 0 |
| [click plot for closeup] |
Plot 3
scores: not implemented
| | data source: | kmos_std
(QC1 database) |
| dataset: | psf_fwhm_ifu18 | • |
| average: | none |
| thresholds: | none |
| N_data plotted: | 0 |
| [click plot for closeup] |
Plot 4
scores: not implemented
| | data source: | kmos_std
(QC1 database) |
| dataset: | psf_fwhm_ifu12 | • |
| mean: | no data | none |
| thresholds: | none | |
| N_data plotted: | 0 |
| [click plot for closeup] |
Plot 5
scores: not implemented
| | data source: | kmos_std
(QC1 database) |
| dataset: | psf_fwhm_ifu18 | • |
| mean: | no data | none |
| thresholds: | none | |
| N_data plotted: | 0 |
| [click plot for closeup] |
Plot 6
scores: not implemented
| | data source: | kmos_std
(QC1 database) |
| dataset: | psf_fwhm_ifu18 | • |
| mean: | no data | none |
| thresholds: | none | |
| N_data plotted: | 0 |
| [click plot for closeup] |
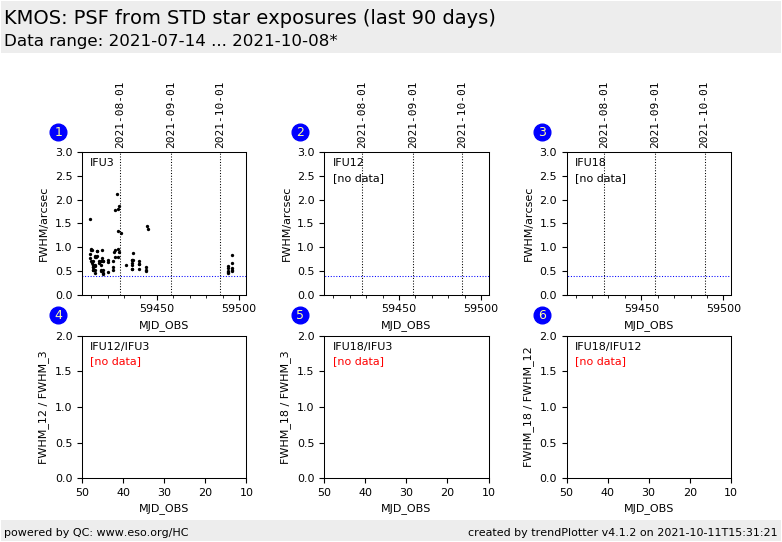
Point Spread Function (PSF) as measured from standard star observations.
The average FWHM of the PSF in re-constructed images from standard star
observations is measured. This quantity is monitored over time for the three
most frequently used IFUs number 3, 12, and 19, which correspond to the three
spectroscopic channels of the instrument. A horizontal line is plotted as
reference.
The lower row shows the ratios FWHM(IFU12)/FWHM(IFU3),
FWHM(IFU19)/FWHM(IFU3), and FWHM(IFU19)/FWHM(IFU12) so that deviating IFUs
are more easily visible. Additionally, a second plot has the FWHM of one IFU
against another IFU.
Please note that since end of November 2014 IFU 18 is used instead of IFU 19.
General information
Click on any of the plots to see a close-up version.
The latest date is indicated on top of the plot.
If configured,
- data points belonging to the latest date are specially marked
- statistical averages are indicated by a solid line, and thresholds by broken lines
- outliers are marked by a red asterisk. They are defined as data points outside the
threshold lines
- "aliens" (= data points outside the plot Y limits) are marked by a red arrow (↑ or ↓)
- you can download the data for each parameter set if the 'Data downloads' link shows up
|
