Plot
? |
Symb
? |
Source
* |
Average ? |
Thresholds ? |
N_
data |
QC1
parameter |
Data
downloads |
Remarks |
| method |
value |
unit |
method |
value |
| 1 |
• | QC1DB |
MEDIAN |
77 |
NONE |
VAL | 73.,80. |
95 |
slice24_fit_nlines |
this |
last_yr |
all
|
averaged for slice24 in all IFUs |
| 1 |
• | QC1DB |
none |
|
NONE |
none | |
95 |
slice1_fit_nlines |
this |
last_yr |
all
|
averaged for slice1 in all IFUs |
| 2 |
• | QC1DB |
MEDIAN |
77 |
NONE |
VAL | 73.,80. |
95 |
slice24_fit_nlines |
this |
last_yr |
all
|
averaged for slice24 in all IFUs |
| 2 |
• | QC1DB |
none |
|
NONE |
none | |
95 |
slice1_fit_nlines |
this |
last_yr |
all
|
averaged for slice1 in all IFUs |
| 3 |
• | QC1DB |
MEDIAN |
0.0269 |
A |
VAL | 0.02,0.035 |
95 |
slice24_fit_rms |
this |
last_yr |
all
|
averaged for slice24 in all IFUs |
| 3 |
• | QC1DB |
none |
|
A |
none | |
95 |
slice1_fit_rms |
this |
last_yr |
all
|
averaged for slice1 in all IFUs |
| 4 |
• | QC1DB |
MEDIAN |
0.0269 |
ADU |
VAL | 0.02,0.035 |
95 |
slice24_fit_rms |
this |
last_yr |
all
|
averaged for slice24 in all IFUs |
| 4 |
• | QC1DB |
none |
|
ADU |
none | |
95 |
slice1_fit_rms |
this |
last_yr |
all
|
averaged for slice1 in all IFUs |
| |
|
*Data sources: QC1DB: QC1 database; LOCAL: local data source
|
Plot 1
scores: multiple dataset, cannot be scored
| | data source: | muse_wave
(QC1 database) |
dataset:
(numbers below apply to this dataset) | slice24_fit_nlines | • |
| median: | 77 | NONE |
| fixed thresholds: | 73.0...80.0 | NONE |
| N_data plotted: | 95 |
| [click plot for closeup] |
Plot 2
scores: multiple dataset, cannot be scored
| | data source: | muse_wave
(QC1 database) |
dataset:
(numbers below apply to this dataset) | slice24_fit_nlines | • |
| median: | 77 | NONE |
| fixed thresholds: | 73.0...80.0 | NONE |
| N_data plotted: | 95 |
| [click plot for closeup] |
Plot 3
scores: multiple dataset, cannot be scored
| | data source: | muse_wave
(QC1 database) |
dataset:
(numbers below apply to this dataset) | slice24_fit_rms | • |
| median: | 0.0269 | A |
| fixed thresholds: | 0.02...0.035 | A |
| N_data plotted: | 95 |
| [click plot for closeup] |
Plot 4
scores: multiple dataset, cannot be scored
| | data source: | muse_wave
(QC1 database) |
dataset:
(numbers below apply to this dataset) | slice24_fit_rms | • |
| median: | 0.0269 | ADU |
| fixed thresholds: | 0.02...0.035 | ADU |
| N_data plotted: | 95 |
| [click plot for closeup] |
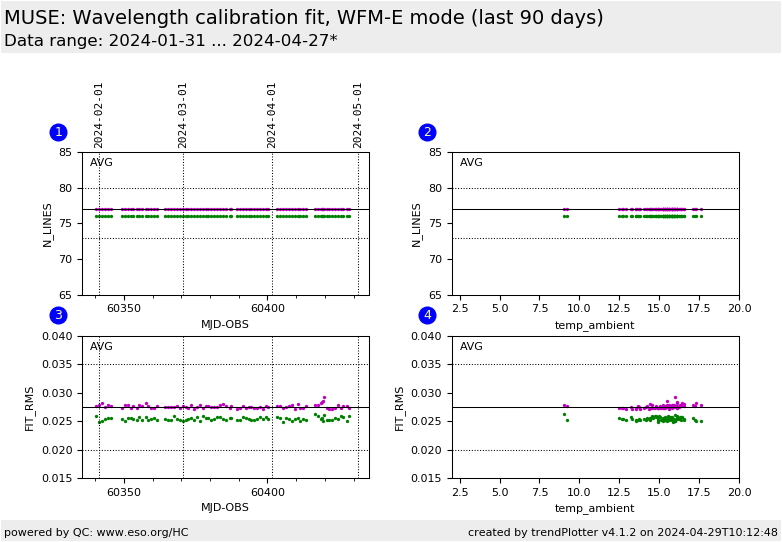
This is MUSE ARC_fit health check plot. The upper panels show the
number of identified arc lines used in calibration solution fit in
central slice24 (red dots) and border slice1 (blue dots), as a
function of time (panels 1) and ambient temperature (panel 3). The
lower panels plot the RMS value of the fit for slice24 and slice1
accordingly. Only data points determined from ARC calibrations taken in
the instrumental mode (INS.MODE) WFM-NOAO-N and the read out
mode (DET.READ.CURNAME) SCI1.0 were selected. The data for
each slice are averaged across all detectors (CHANELs).
The ARC calibration data are taken with template TPL.ID=MUSE_wfm_cal_wave
General information
Click on any of the plots to see a close-up version.
The latest date is indicated on top of the plot.
If configured,
- data points belonging to the latest date are specially marked
- statistical averages are indicated by a solid line, and thresholds by broken lines
- outliers are marked by a red asterisk. They are defined as data points outside the
threshold lines
- "aliens" (= data points outside the plot Y limits) are marked by a red arrow (↑ or ↓)
- you can download the data for each parameter set if the 'Data downloads' link shows up
|
