Plot
? |
Symb
? |
Source
* |
Average ? |
Thresholds ? |
N_
data |
QC1
parameter |
Data
downloads |
Remarks |
| method |
value |
unit |
method |
value |
| 1 |
• | QC1DB |
none |
|
NONE |
none | |
89 |
topslice_flux |
this |
last_yr |
all
|
avg flux in top row slices (10,22,34,46) / avg flux in all slices in CHAN05 |
| 1 |
• | QC1DB |
none |
|
NONE |
none | |
89 |
bottomslice_flux |
this |
last_yr |
all
|
avg flux in bottom row slices (3,15,27,39) / avg flux in all slices in CHAN05 |
| 2 |
• | QC1DB |
none |
|
NONE |
none | |
89 |
topslice_flux |
this |
last_yr |
all
|
avg flux in top row slices (10,22,34,46) / avg flux in all slices in CHAN03 |
| 2 |
• | QC1DB |
none |
|
NONE |
none | |
89 |
bottomslice_flux |
this |
last_yr |
all
|
avg flux in bottom row slices (3,15,27,39) / avg flux in all slices in CHAN03 |
| 3 |
• | QC1DB |
none |
|
NONE |
none | |
89 |
topslice_flux |
this |
last_yr |
all
|
avg flux in top row slices (10,22,34,46) / avg flux in all slices in CHAN01 |
| 3 |
• | QC1DB |
none |
|
NONE |
none | |
89 |
bottomslice_flux |
this |
last_yr |
all
|
avg flux in bottom row slices (3,15,27,39) / avg flux in all slices in CHAN01 |
| 4 |
• | QC1DB |
none |
|
NONE |
none | |
89 |
topslice_flux |
this |
last_yr |
all
|
avg flux in top row slices (10,22,34,46) / avg flux in all slices in CHAN02 |
| 4 |
• | QC1DB |
none |
|
NONE |
none | |
89 |
bottomslice_flux |
this |
last_yr |
all
|
avg flux in bottom row slices (3,15,27,39) / avg flux in all slices in CHAN02 |
| 5 |
• | QC1DB |
none |
|
NONE |
none | |
89 |
topslice_flux |
this |
last_yr |
all
|
avg flux in top row slices (10,22,34,46) / avg flux in all slices in CHAN04 |
| 5 |
• | QC1DB |
none |
|
NONE |
none | |
89 |
bottomslice_flux |
this |
last_yr |
all
|
avg flux in bottom row slices (3,15,27,39) / avg flux in all slices in CHAN04 |
| 6 |
• | QC1DB |
none |
|
NONE |
none | |
89 |
topslice_flux |
this |
last_yr |
all
|
avg flux in top row slices (10,22,34,46) / avg flux in all slices in CHAN06 |
| 6 |
• | QC1DB |
none |
|
NONE |
none | |
89 |
bottomslice_flux |
this |
last_yr |
all
|
avg flux in bottom row slices (3,15,27,39) / avg flux in all slices in CHAN06 |
| 7 |
• | QC1DB |
none |
|
NONE |
none | |
89 |
topslice_flux |
this |
last_yr |
all
|
avg flux in top row slices (10,22,34,46) / avg flux in all slices in CHAN11 |
| 7 |
• | QC1DB |
none |
|
NONE |
none | |
89 |
bottomslice_flux |
this |
last_yr |
all
|
avg flux in bottom row slices (3,15,27,39) / avg flux in all slices in CHAN11 |
| 8 |
• | QC1DB |
none |
|
NONE |
none | |
89 |
topslice_flux |
this |
last_yr |
all
|
avg flux in top row slices (10,22,34,46) / avg flux in all slices in CHAN09 |
| 8 |
• | QC1DB |
none |
|
NONE |
none | |
89 |
bottomslice_flux |
this |
last_yr |
all
|
avg flux in bottom row slices (3,15,27,39) / avg flux in all slices in CHAN09 |
| 9 |
• | QC1DB |
none |
|
NONE |
none | |
89 |
topslice_flux |
this |
last_yr |
all
|
avg flux in top row slices (10,22,34,46) / avg flux in all slices in CHAN07 |
| 9 |
• | QC1DB |
none |
|
NONE |
none | |
89 |
bottomslice_flux |
this |
last_yr |
all
|
avg flux in bottom row slices (3,15,27,39) / avg flux in all slices in CHAN07 |
| 10 |
• | QC1DB |
none |
|
NONE |
none | |
89 |
topslice_flux |
this |
last_yr |
all
|
avg flux in top row slices (10,22,34,46) / avg flux in all slices in CHAN08 |
| 10 |
• | QC1DB |
none |
|
NONE |
none | |
89 |
bottomslice_flux |
this |
last_yr |
all
|
avg flux in bottom row slices (3,15,27,39) / avg flux in all slices in CHAN08 |
| 11 |
• | QC1DB |
none |
|
NONE |
none | |
89 |
topslice_flux |
this |
last_yr |
all
|
avg flux in top row slices (10,22,34,46) / avg flux in all slices in CHAN10 |
| 11 |
• | QC1DB |
none |
|
NONE |
none | |
89 |
bottomslice_flux |
this |
last_yr |
all
|
avg flux in bottom row slices (3,15,27,39) / avg flux in all slices in CHAN10 |
| 12 |
• | QC1DB |
none |
|
NONE |
none | |
89 |
topslice_flux |
this |
last_yr |
all
|
avg flux in top row slices (10,22,34,46) / avg flux in all slices in CHAN12 |
| 12 |
• | QC1DB |
none |
|
NONE |
none | |
89 |
bottomslice_flux |
this |
last_yr |
all
|
avg flux in bottom row slices (3,15,27,39) / avg flux in all slices in CHAN12 |
| 13 |
• | QC1DB |
none |
|
NONE |
none | |
89 |
topslice_flux |
this |
last_yr |
all
|
avg flux in top row slices (10,22,34,46) / avg flux in all slices in CHAN17 |
| 13 |
• | QC1DB |
none |
|
NONE |
none | |
89 |
bottomslice_flux |
this |
last_yr |
all
|
avg flux in bottom row slices (3,15,27,39) / avg flux in all slices in CHAN17 |
| 14 |
• | QC1DB |
none |
|
NONE |
none | |
89 |
topslice_flux |
this |
last_yr |
all
|
avg flux in top row slices (10,22,34,46) / avg flux in all slices in CHAN15 |
| 14 |
• | QC1DB |
none |
|
NONE |
none | |
89 |
bottomslice_flux |
this |
last_yr |
all
|
avg flux in bottom row slices (3,15,27,39) / avg flux in all slices in CHAN15 |
| 15 |
• | QC1DB |
none |
|
NONE |
none | |
89 |
topslice_flux |
this |
last_yr |
all
|
avg flux in top row slices (10,22,34,46) / avg flux in all slices in CHAN13 |
| 15 |
• | QC1DB |
none |
|
NONE |
none | |
89 |
bottomslice_flux |
this |
last_yr |
all
|
avg flux in bottom row slices (3,15,27,39) / avg flux in all slices in CHAN13 |
| 16 |
• | QC1DB |
none |
|
NONE |
none | |
89 |
topslice_flux |
this |
last_yr |
all
|
avg flux in top row slices (10,22,34,46) / avg flux in all slices in CHAN14 |
| 16 |
• | QC1DB |
none |
|
NONE |
none | |
89 |
bottomslice_flux |
this |
last_yr |
all
|
avg flux in bottom row slices (3,15,27,39) / avg flux in all slices in CHAN14 |
| 17 |
• | QC1DB |
none |
|
NONE |
none | |
89 |
topslice_flux |
this |
last_yr |
all
|
avg flux in top row slices (10,22,34,46) / avg flux in all slices in CHAN16 |
| 17 |
• | QC1DB |
none |
|
NONE |
none | |
89 |
bottomslice_flux |
this |
last_yr |
all
|
avg flux in bottom row slices (3,15,27,39) / avg flux in all slices in CHAN16 |
| 18 |
• | QC1DB |
none |
|
NONE |
none | |
89 |
topslice_flux |
this |
last_yr |
all
|
avg flux in top row slices (10,22,34,46) / avg flux in all slices in CHAN18 |
| 18 |
• | QC1DB |
none |
|
NONE |
none | |
89 |
bottomslice_flux |
this |
last_yr |
all
|
avg flux in bottom row slices (3,15,27,39) / avg flux in all slices in CHAN18 |
| 19 |
• | QC1DB |
none |
|
NONE |
none | |
89 |
topslice_flux |
this |
last_yr |
all
|
avg flux in top row slices (10,22,34,46) / avg flux in all slices in CHAN23 |
| 19 |
• | QC1DB |
none |
|
NONE |
none | |
89 |
bottomslice_flux |
this |
last_yr |
all
|
avg flux in bottom row slices (3,15,27,39) / avg flux in all slices in CHAN23 |
| 20 |
• | QC1DB |
none |
|
NONE |
none | |
89 |
topslice_flux |
this |
last_yr |
all
|
avg flux in top row slices (10,22,34,46) / avg flux in all slices in CHAN21 |
| 20 |
• | QC1DB |
none |
|
NONE |
none | |
89 |
bottomslice_flux |
this |
last_yr |
all
|
avg flux in bottom row slices (3,15,27,39) / avg flux in all slices in CHAN21 |
| 21 |
• | QC1DB |
none |
|
NONE |
none | |
89 |
topslice_flux |
this |
last_yr |
all
|
avg flux in top row slices (10,22,34,46) / avg flux in all slices in CHAN19 |
| 21 |
• | QC1DB |
none |
|
NONE |
none | |
89 |
bottomslice_flux |
this |
last_yr |
all
|
avg flux in bottom row slices (3,15,27,39) / avg flux in all slices in CHAN19 |
| 22 |
• | QC1DB |
none |
|
NONE |
none | |
89 |
topslice_flux |
this |
last_yr |
all
|
avg flux in top row slices (10,22,34,46) / avg flux in all slices in CHAN20 |
| 22 |
• | QC1DB |
none |
|
NONE |
none | |
89 |
bottomslice_flux |
this |
last_yr |
all
|
avg flux in bottom row slices (3,15,27,39) / avg flux in all slices in CHAN20 |
| 23 |
• | QC1DB |
none |
|
NONE |
none | |
89 |
topslice_flux |
this |
last_yr |
all
|
avg flux in top row slices (10,22,34,46) / avg flux in all slices in CHAN22 |
| 23 |
• | QC1DB |
none |
|
NONE |
none | |
89 |
bottomslice_flux |
this |
last_yr |
all
|
avg flux in bottom row slices (3,15,27,39) / avg flux in all slices in CHAN22 |
| 24 |
• | QC1DB |
none |
|
NONE |
none | |
89 |
topslice_flux |
this |
last_yr |
all
|
avg flux in top row slices (10,22,34,46) / avg flux in all slices in CHAN24 |
| 24 |
• | QC1DB |
none |
|
NONE |
none | |
89 |
bottomslice_flux |
this |
last_yr |
all
|
avg flux in bottom row slices (3,15,27,39) / avg flux in all slices in CHAN24 |
| |
|
*Data sources: QC1DB: QC1 database; LOCAL: local data source
|
Plot 3
scores: not implemented
| | data source: | muse_lampflat
(QC1 database) |
dataset:
(numbers below apply to this dataset) | topslice_flux | • |
| average: | none |
| thresholds: | none |
| N_data plotted: | 89 |
| [click plot for closeup] |
Plot 4
scores: not implemented
| | data source: | muse_lampflat
(QC1 database) |
dataset:
(numbers below apply to this dataset) | topslice_flux | • |
| average: | none |
| thresholds: | none |
| N_data plotted: | 89 |
| [click plot for closeup] |
Plot 2
scores: not implemented
| | data source: | muse_lampflat
(QC1 database) |
dataset:
(numbers below apply to this dataset) | topslice_flux | • |
| average: | none |
| thresholds: | none |
| N_data plotted: | 89 |
| [click plot for closeup] |
Plot 5
scores: not implemented
| | data source: | muse_lampflat
(QC1 database) |
dataset:
(numbers below apply to this dataset) | topslice_flux | • |
| average: | none |
| thresholds: | none |
| N_data plotted: | 89 |
| [click plot for closeup] |
Plot 1
scores: not implemented
| | data source: | muse_lampflat
(QC1 database) |
dataset:
(numbers below apply to this dataset) | topslice_flux | • |
| average: | none |
| thresholds: | none |
| N_data plotted: | 89 |
| [click plot for closeup] |
Plot 6
scores: not implemented
| | data source: | muse_lampflat
(QC1 database) |
dataset:
(numbers below apply to this dataset) | topslice_flux | • |
| average: | none |
| thresholds: | none |
| N_data plotted: | 89 |
| [click plot for closeup] |
Plot 9
scores: not implemented
| | data source: | muse_lampflat
(QC1 database) |
dataset:
(numbers below apply to this dataset) | topslice_flux | • |
| average: | none |
| thresholds: | none |
| N_data plotted: | 89 |
| [click plot for closeup] |
Plot 10
scores: not implemented
| | data source: | muse_lampflat
(QC1 database) |
dataset:
(numbers below apply to this dataset) | topslice_flux | • |
| average: | none |
| thresholds: | none |
| N_data plotted: | 89 |
| [click plot for closeup] |
Plot 8
scores: not implemented
| | data source: | muse_lampflat
(QC1 database) |
dataset:
(numbers below apply to this dataset) | topslice_flux | • |
| average: | none |
| thresholds: | none |
| N_data plotted: | 89 |
| [click plot for closeup] |
Plot 11
scores: not implemented
| | data source: | muse_lampflat
(QC1 database) |
dataset:
(numbers below apply to this dataset) | topslice_flux | • |
| average: | none |
| thresholds: | none |
| N_data plotted: | 89 |
| [click plot for closeup] |
Plot 7
scores: not implemented
| | data source: | muse_lampflat
(QC1 database) |
dataset:
(numbers below apply to this dataset) | topslice_flux | • |
| average: | none |
| thresholds: | none |
| N_data plotted: | 89 |
| [click plot for closeup] |
Plot 12
scores: not implemented
| | data source: | muse_lampflat
(QC1 database) |
dataset:
(numbers below apply to this dataset) | topslice_flux | • |
| average: | none |
| thresholds: | none |
| N_data plotted: | 89 |
| [click plot for closeup] |
Plot 15
scores: not implemented
| | data source: | muse_lampflat
(QC1 database) |
dataset:
(numbers below apply to this dataset) | topslice_flux | • |
| average: | none |
| thresholds: | none |
| N_data plotted: | 89 |
| [click plot for closeup] |
Plot 16
scores: not implemented
| | data source: | muse_lampflat
(QC1 database) |
dataset:
(numbers below apply to this dataset) | topslice_flux | • |
| average: | none |
| thresholds: | none |
| N_data plotted: | 89 |
| [click plot for closeup] |
Plot 14
scores: not implemented
| | data source: | muse_lampflat
(QC1 database) |
dataset:
(numbers below apply to this dataset) | topslice_flux | • |
| average: | none |
| thresholds: | none |
| N_data plotted: | 89 |
| [click plot for closeup] |
Plot 17
scores: not implemented
| | data source: | muse_lampflat
(QC1 database) |
dataset:
(numbers below apply to this dataset) | topslice_flux | • |
| average: | none |
| thresholds: | none |
| N_data plotted: | 89 |
| [click plot for closeup] |
Plot 13
scores: not implemented
| | data source: | muse_lampflat
(QC1 database) |
dataset:
(numbers below apply to this dataset) | topslice_flux | • |
| average: | none |
| thresholds: | none |
| N_data plotted: | 89 |
| [click plot for closeup] |
Plot 18
scores: not implemented
| | data source: | muse_lampflat
(QC1 database) |
dataset:
(numbers below apply to this dataset) | topslice_flux | • |
| average: | none |
| thresholds: | none |
| N_data plotted: | 89 |
| [click plot for closeup] |
Plot 21
scores: not implemented
| | data source: | muse_lampflat
(QC1 database) |
dataset:
(numbers below apply to this dataset) | topslice_flux | • |
| average: | none |
| thresholds: | none |
| N_data plotted: | 89 |
| [click plot for closeup] |
Plot 22
scores: not implemented
| | data source: | muse_lampflat
(QC1 database) |
dataset:
(numbers below apply to this dataset) | topslice_flux | • |
| average: | none |
| thresholds: | none |
| N_data plotted: | 89 |
| [click plot for closeup] |
Plot 20
scores: not implemented
| | data source: | muse_lampflat
(QC1 database) |
dataset:
(numbers below apply to this dataset) | topslice_flux | • |
| average: | none |
| thresholds: | none |
| N_data plotted: | 89 |
| [click plot for closeup] |
Plot 23
scores: not implemented
| | data source: | muse_lampflat
(QC1 database) |
dataset:
(numbers below apply to this dataset) | topslice_flux | • |
| average: | none |
| thresholds: | none |
| N_data plotted: | 89 |
| [click plot for closeup] |
Plot 19
scores: not implemented
| | data source: | muse_lampflat
(QC1 database) |
dataset:
(numbers below apply to this dataset) | topslice_flux | • |
| average: | none |
| thresholds: | none |
| N_data plotted: | 89 |
| [click plot for closeup] |
Plot 24
scores: not implemented
| | data source: | muse_lampflat
(QC1 database) |
dataset:
(numbers below apply to this dataset) | topslice_flux | • |
| average: | none |
| thresholds: | none |
| N_data plotted: | 89 |
| [click plot for closeup] |
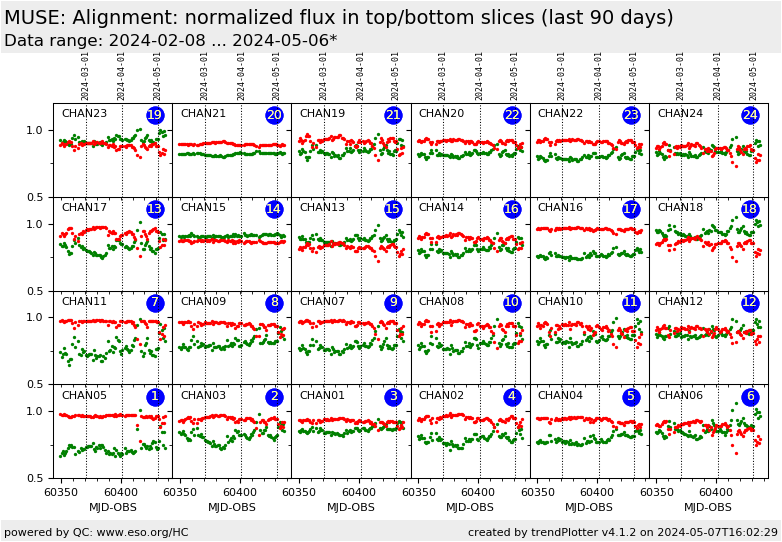
This is MUSE FLAT_algnm health check plot. It monitors alignment of
each channel by monitoring average flux in 4 top raw slices - slice
10, 22, 34, 46, normalized by the average flux in all slices in each
channel (red dots) and average flux in 4 bottom row slices: slice 3,
15, 27, 39, normalized by the average flux in all slices in each
channel as well (green dots). Only data points extracted from
LAMP_FLAT calibrations taken in the instrumental mode (INS.MODE)
WFM-NOAO-E and the read out mode (DET.READ.CURNAME)
SCI1.0 are selected.
The LAMP_FLAT calibration data are taken with template
TPL.ID=MUSE_wfm_cal_specflat
General information
Click on any of the plots to see a close-up version.
The latest date is indicated on top of the plot.
If configured,
- data points belonging to the latest date are specially marked
- statistical averages are indicated by a solid line, and thresholds by broken lines
- outliers are marked by a red asterisk. They are defined as data points outside the
threshold lines
- "aliens" (= data points outside the plot Y limits) are marked by a red arrow (↑ or ↓)
- you can download the data for each parameter set if the 'Data downloads' link shows up
|
