Plot
? |
Symb
? |
Source
* |
Average ? |
Thresholds ? |
N_
data |
QC1
parameter |
Data
downloads |
Remarks |
| method |
value |
unit |
method |
value |
| 1 |
• | QC1DB |
MEAN |
502 |
number |
none | |
171 |
N_AB_EXE |
all (full time range)
| SINFONI
1. number of all executed ABs per month (after 2011-10: CALIB) |
| 2 |
• | QC1DB |
MEAN |
21.5 |
hours |
none | |
171 |
T_AB_EXE |
all (full time range)
| 2. total AB processing time per month (hours) |
| 4 |
• | QC1DB |
MEAN |
4.72 |
hours |
none | |
119 |
T_QC_EXE |
all (full time range)
| 3. total QC report execution time per month (hours) |
| |
|
*Data sources: QC1DB: QC1 database; LOCAL: local data source
|
| Plot 1 | | data source: | monthly_stat
(QC1 database) |
| dataset: | N_AB_EXE | • |
| mean: | 502 | number |
| thresholds: | none | |
| N_data plotted: | 171 |
| [click plot for closeup] |
| Plot 2 | | data source: | monthly_stat
(QC1 database) |
| dataset: | T_AB_EXE | • |
| mean: | 21.5 | hours |
| thresholds: | none | |
| N_data plotted: | 171 |
| [click plot for closeup] |
| Plot 4 | | data source: | monthly_stat
(QC1 database) |
| dataset: | T_QC_EXE | • |
| mean: | 4.72 | hours |
| thresholds: | none | |
| N_data plotted: | 119 |
| [click plot for closeup] |
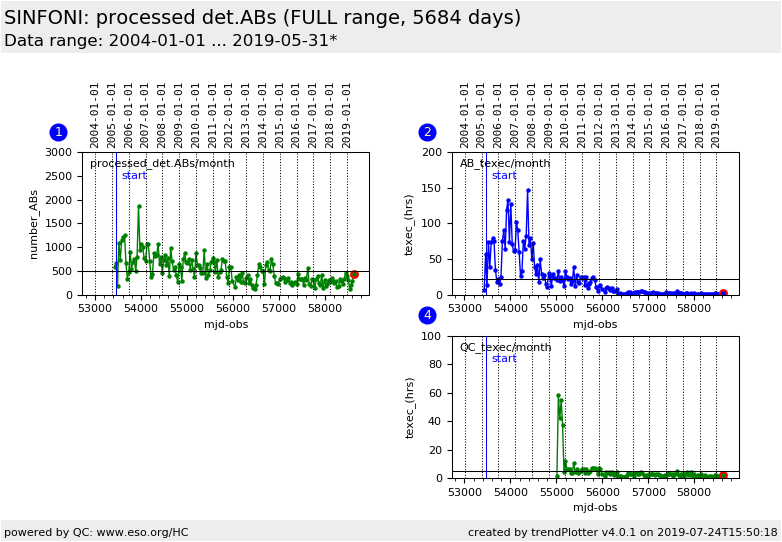
This plot visualizes the monthly statistics of executed detector ABs
('det.ABs'):
- number of all successfully processed ABs
(before XXLight: successful CAL+SCI; with XXLight: successful CAL only),
- total execution time for ABs in hours
(pipeline processing),
- total QC report execution time in hours.
The significant drop in execution times in 2013-04 is caused by the migration to the muc machines,
with a significant gain in compute performance.
The det.AB number refers to jobs per detector and is higher by a factor MEF_FACTOR
than the actual number of ABs as counted in the QC system and displayed in the
AB certification plot.
For reference, MEF_FACTOR=4 for
CRIRES and HAWKI; 16 for VIRCAM; 32 for OCAM; 3 for KMOS; 24 for MUSE. This number measures
the compute workload.
The numbers for AB_texec and QC_texec are the sum of execution times for all
processed ABs (including the failed ones), without further correction for
MEF_FACTOR.
Note: The latest data point in the current plot usually refers to a month which is not yet finished.
Its value will therefore continue to increase until a new last month starts.
General information
Click on any of the plots to see a close-up version.
The latest date is indicated on top of the plot.
If configured,
- data points belonging to the latest date are specially marked
- statistical averages are indicated by a solid line, and thresholds by broken lines
- outliers are marked by a red asterisk. They are defined as data points outside the
threshold lines
- "aliens" (= data points outside the plot Y limits) are marked by a red arrow (↑ or ↓)
- you can download the data for each parameter set if the 'Data downloads' link shows up
|
