d) IDP products (main and ANC files, since 2017-12) [GB]
*Data sources: QC1DB: QC1 database; LOCAL: local data source
Plot 1
data source:
monthly_stat (QC1 database)
dataset: (numbers below apply to this dataset)
GB_CAL_PRO
•
average:
none
thresholds:
none
N_data plotted:
179
[click plot for closeup]
Plot 2
data source:
monthly_idpstat (QC1 database)
dataset:
GB_SCI_PRO_ALL
o
average:
none
thresholds:
none
N_data plotted:
77
[click plot for closeup]
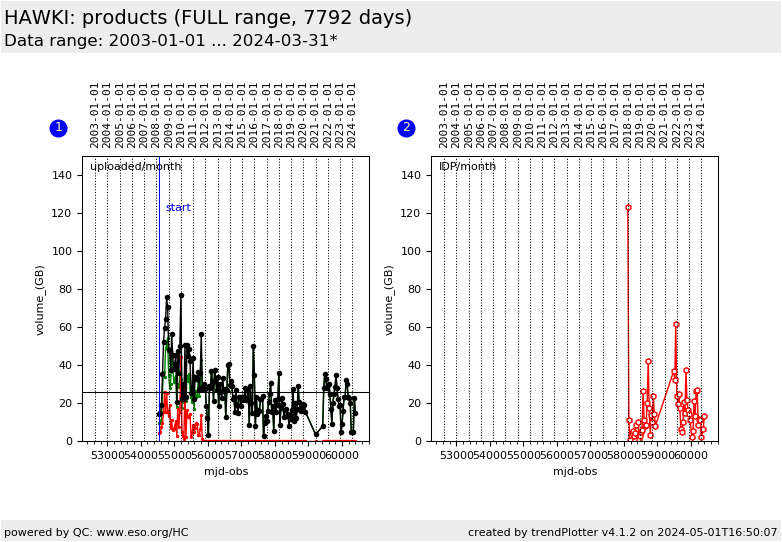
This plot
This plot visualizes the monthly product data creation and uploads (NGAS ingestion). Data creation splits by
calibrations (CAL) and science (SCI).
The right graph collects the volume of all ingested IDPs and ancillary files
per month.
Note: The latest data point in the current plot usually refers to a month which is not yet finished.
Its value will therefore continue to increase until a new last month starts.
General information
Click on any of the plots to see a close-up version.
The latest date is indicated on top of the plot.
If configured,
data points belonging to the latest date are specially marked
statistical averages are indicated by a solid line, and thresholds by broken lines
outliers are marked by a red asterisk. They are defined as data points outside the
threshold lines
"aliens" (= data points outside the plot Y limits) are marked by a red arrow (↑ or ↓)
you can download the data for each parameter set if the 'Data downloads' link shows up
