*Data sources: QC1DB: QC1 database; LOCAL: local data source
Plot 1
data source:
monthly_idpdown (QC1 database)
dataset: (numbers below apply to this dataset)
AGG_N_FILES
•
average:
none
thresholds:
none
N_data plotted:
40
[click plot for closeup]
Plot 2
data source:
monthly_idpdown (QC1 database)
dataset:
AGG_N_REQ
•
average:
none
thresholds:
none
N_data plotted:
40
[click plot for closeup]
Plot 3
data source:
monthly_idpdown (QC1 database)
dataset:
INC_N_FILES
•
median:
0
number
thresholds:
none
N_data plotted:
40
[click plot for closeup]
Plot 4
data source:
monthly_idpdown (QC1 database)
dataset:
INC_N_REQ
•
median:
0
number
thresholds:
none
N_data plotted:
40
[click plot for closeup]
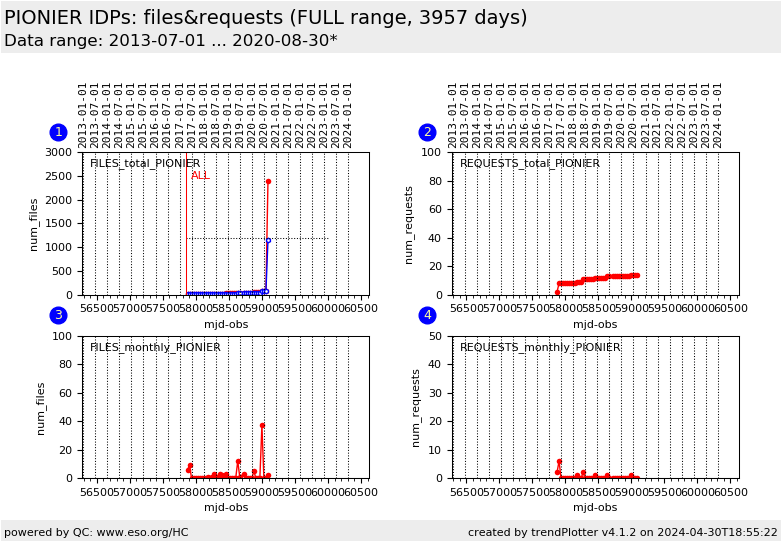
This plot
This plot visualizes the monthly download requests of IDPs. The upper row
displays cumulated numbers, the lower panel monthly numbers. The left panel
displays downloaded files, the right panel the number of download requests.
In general, the plotted datasets display total numbers and numbers selected
for priviledged access (PIs only). For reference, the first report has also
the number of ingested IDPs available for download (except for some
instruments which are not managed by QC).
