Plot
? |
Symb
? |
Source
* |
Average ? |
Thresholds ? |
N_
data |
QC1
parameter |
Data
downloads |
Remarks |
| method |
value |
unit |
method |
value |
| 1 |
■ | QC1DB |
MEAN |
3.91e+03 |
GB/month |
none | |
264 |
GB_ALL_RAW |
all (full time range)
| ALL instruments: processed raw data per month [GB]
a) ALL data types |
| 1 |
o | QC1DB |
none |
|
GB/month |
none | |
264 |
GB_CAL_RAW |
all (full time range)
| b) CALibrations |
| 1 |
o | QC1DB |
none |
|
GB/month |
none | |
264 |
GB_SCI_RAW |
all (full time range)
| c) SCIence |
|
| 2 |
■ | QC1DB |
MEAN |
3.91e+03 |
GB/month |
none | |
264 |
GB_ALL_RAW |
all (full time range)
| All processed raw data per month [GB]
a) ALL instruments |
| 2 |
o | QC1DB |
none |
|
GB/month |
none | |
160 |
GB_ALL_RAW |
all (full time range)
| b) survey camera: VIRCAM
|
| 2 |
o | QC1DB |
none |
|
GB/month |
none | |
158 |
GB_ALL_RAW |
all (full time range)
| c) survey camera: OCAM
|
| 2 |
o | QC1DB |
none |
|
GB/month |
none | |
119 |
GB_ALL_RAW |
all (full time range)
| d) MUSE
(VLT ins. with biggest data vol.) |
| 2 |
∗ | QC1DB |
none |
|
GB/month |
none | |
152 |
GB_SCI_RAW |
all (full time range)
| e) IDPs |
| |
|
*Data sources: QC1DB: QC1 database; LOCAL: local data source
|
| Plot 1 | | data source: | monthly_stat
(QC1 database) |
dataset:
(numbers below apply to this dataset) | GB_ALL_RAW | ■ |
| mean: | 3.91e+03 | GB/month |
| thresholds: | none | |
| N_data plotted: | 264 |
| [click plot for closeup] |
| Plot 2 | | data source: | monthly_stat
(QC1 database) |
dataset:
(numbers below apply to this dataset) | GB_ALL_RAW | ■ |
| mean: | 3.91e+03 | GB/month |
| thresholds: | none | |
| N_data plotted: | 264 |
| [click plot for closeup] |
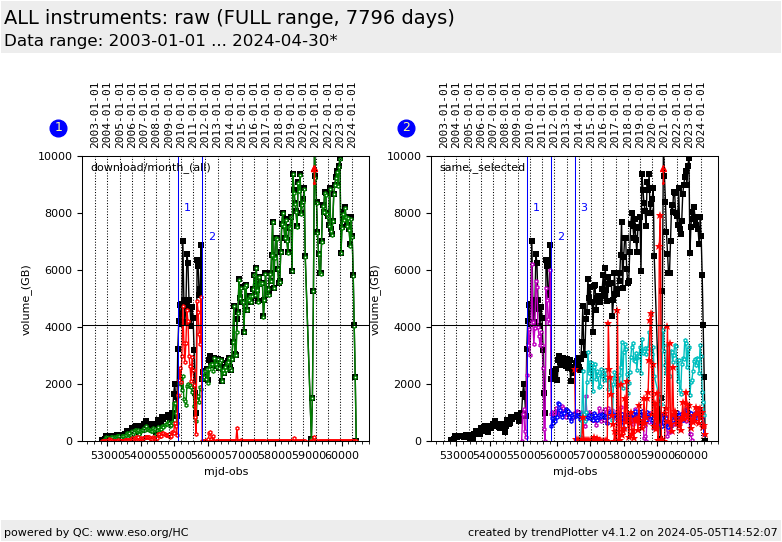
This plot visualizes the monthly volume of QC-processed raw data. The first plot displays
the data for all instruments, split by
calibrations (CAL), science (SCI) and total sum (ALL, including acquisitions).
The second graph displays the same total sum, and some of its components, like
VIRCAM, OMEGACAM,
and MUSE (starting 2014-02). The raw data volume downloaded for
the IDP process is also displayed.
Comment 1: begin of operations for survey cameras;
Comment 2: 2011-10-01 end of SCIENCE processing;
Comment 3: 2013-09 begin of IDP processing.
The last data point in the current plot usually refers to a month which is not yet finished.
Its value will therefore continue to increase until a new last month starts.
General information
Click on any of the plots to see a close-up version.
The latest date is indicated on top of the plot.
If configured,
- data points belonging to the latest date are specially marked
- statistical averages are indicated by a solid line, and thresholds by broken lines
- outliers are marked by a red asterisk. They are defined as data points outside the
threshold lines
- "aliens" (= data points outside the plot Y limits) are marked by a red arrow (↑ or ↓)
- you can download the data for each parameter set if the 'Data downloads' link shows up
|
