Plot
? |
Symb
? |
Source
* |
Average ? |
Thresholds ? |
N_
data |
QC1
parameter |
Data
downloads |
Remarks |
| method |
value |
unit |
method |
value |
| 1 |
• | QC1DB |
MEDIAN |
-8.67 |
ADU |
VAL | -13.,-2. |
27 |
dark_median |
this |
last_yr |
all
|
DARK_median, wlen_id=J1228, dit=3.0, CHIP1 |
| 2 |
• | QC1DB |
MEDIAN |
-3.67 |
ADU |
VAL | -10.,2. |
27 |
dark_median |
this |
last_yr |
all
|
DARK_median, wlen_id=J1228, dit=3.0, CHIP2 |
| 3 |
• | QC1DB |
MEDIAN |
-5 |
ADU |
VAL | -10.,2. |
27 |
dark_median |
this |
last_yr |
all
|
DARK_median, wlen_id=J1228, dit=3.0, CHIP3 |
| 4 |
• | QC1DB |
MEDIAN |
7.87 |
ADU |
VAL | -5.,20. |
68 |
dark_median |
this |
last_yr |
all
|
DARK_median, wlen_id=J1228, dit=90.0, CHIP1 |
| 5 |
• | QC1DB |
MEDIAN |
9.46 |
ADU |
VAL | -5.,20. |
68 |
dark_median |
this |
last_yr |
all
|
DARK_median, wlen_id=J1228, dit=90.0, CHIP2 |
| 6 |
• | QC1DB |
MEDIAN |
8.17 |
ADU |
VAL | -5.,20. |
68 |
dark_median |
this |
last_yr |
all
|
DARK_median, wlen_id=J1228, dit=90.0, CHIP3 |
| |
|
*Data sources: QC1DB: QC1 database; LOCAL: local data source
|
Plot 1
scores:  8| 8|
| | data source: | criresp_dark
(QC1 database) |
| dataset: | dark_median | • |
| median: | -8.67 | ADU |
| fixed thresholds: | -13.0...-2.0 | ADU |
| N_data plotted: | 27 |
| [click plot for closeup] |
Plot 2
scores: 8|
| | data source: | criresp_dark
(QC1 database) |
| dataset: | dark_median | • |
| median: | -3.67 | ADU |
| fixed thresholds: | -10.0...2.0 | ADU |
| N_data plotted: | 27 |
| [click plot for closeup] |
Plot 3
scores: 8|
| | data source: | criresp_dark
(QC1 database) |
| dataset: | dark_median | • |
| median: | -5 | ADU |
| fixed thresholds: | -10.0...2.0 | ADU |
| N_data plotted: | 27 |
| [click plot for closeup] |
Plot 4
scores: 8|
| | data source: | criresp_dark
(QC1 database) |
| dataset: | dark_median | • |
| median: | 7.87 | ADU |
| fixed thresholds: | -5.0...20.0 | ADU |
| N_data plotted: | 68 |
| [click plot for closeup] |
Plot 5
scores: 8|
| | data source: | criresp_dark
(QC1 database) |
| dataset: | dark_median | • |
| median: | 9.46 | ADU |
| fixed thresholds: | -5.0...20.0 | ADU |
| N_data plotted: | 68 |
| [click plot for closeup] |
Plot 6
scores: 8|
| | data source: | criresp_dark
(QC1 database) |
| dataset: | dark_median | • |
| median: | 8.17 | ADU |
| fixed thresholds: | -5.0...20.0 | ADU |
| N_data plotted: | 68 |
| [click plot for closeup] |
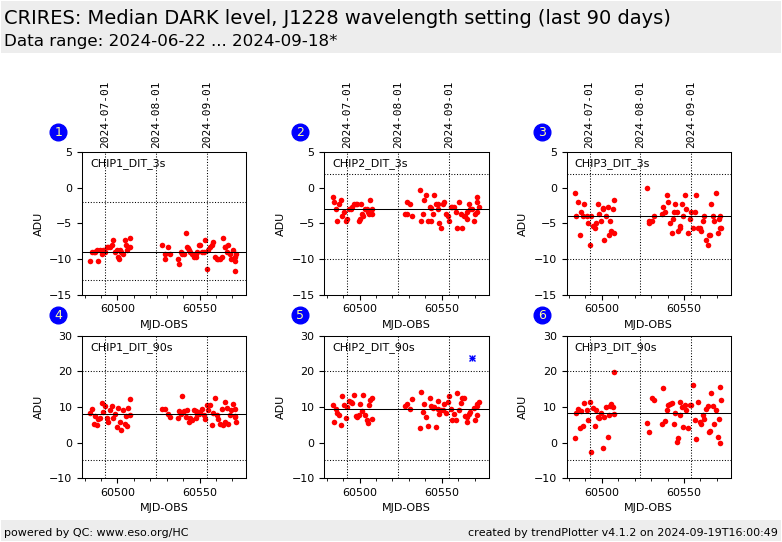
Trending plot for the median level of the CRIRES+ DARK exposures taken
in the J1228 wavelength setting, for each of the detectors.
The median levels of the darks INS.WLEN.ID=J1228, short
DET.DIT=3.0s (2.0s until 2023-04-05) are shown in the upper sub-plots, and for
the long DET.DIT=90.0s in the lower sub-plots.
General information
Click on any of the plots to see a close-up version.
The latest date is indicated on top of the plot.
If configured,
- data points belonging to the latest date are specially marked
- statistical averages are indicated by a solid line, and thresholds by broken lines
- outliers are marked by a red asterisk. They are defined as data points outside the
threshold lines
- "aliens" (= data points outside the plot Y limits) are marked by a red arrow (↑ or ↓)
- you can download the data for each parameter set if the 'Data downloads' link shows up
|
