Plot
? |
Symb
? |
Source
* |
Average ? |
Thresholds ? |
N_
data |
QC1
parameter |
Data
downloads |
Remarks |
| method |
value |
unit |
method |
value |
| 1 |
• | QC1DB |
none |
|
oC |
none | |
181 |
ins_temp53_val |
this |
last_yr |
all
|
temperature T53 (degree Celsius) |
| 2 |
+ | QC1DB |
none |
|
px |
VAL | -1.,5 |
91 |
mean_xdiff |
this |
last_yr |
all
|
deltaX against reference frame, HR grating (Medusa1, H525.8B) |
| 3 |
+ | QC1DB |
none |
|
px |
VAL | -6,0 |
90 |
mean_xdiff |
this |
last_yr |
all
|
as plot 2, LR grating (Medusa1, L543.1) |
|
| 4 |
• | QC1DB |
none |
|
oC |
none | |
181 |
ins_temp53_val |
this |
last_yr |
all
|
T53 (repeated) |
| 5 |
Δ | QC1DB |
none |
|
px |
VAL | -1,3. |
91 |
mean_ydiff |
this |
last_yr |
all
|
deltaY against reference frame, HR grating (Medusa1, H525.8B) |
| 6 |
Δ | QC1DB |
none |
|
px |
VAL | -3.5,1.5 |
90 |
mean_ydiff |
this |
last_yr |
all
|
as plot 5, LR grating (Medusa1, L543.1) |
|
| 7 |
+ | QC1DB |
none |
|
oC/px |
none | |
91 |
ins_temp53_val |
this |
last_yr |
all
|
correlation T53 vs. deltaX, HR grating (Medusa1, H525.8B) |
| 8 |
+ | QC1DB |
none |
|
oC/px |
none | |
90 |
ins_temp53_val |
this |
last_yr |
all
|
as plot 7, LR grating (Medusa1, L543.1) |
| 9 |
Δ | QC1DB |
none |
|
oC/px |
none | |
91 |
ins_temp53_val |
this |
last_yr |
all
|
T53 vs. deltaY, HR grating (Medusa1, H525.8B) |
| 10 |
Δ | QC1DB |
none |
|
oC/px |
none | |
90 |
ins_temp53_val |
this |
last_yr |
all
|
as plot 9, LR grating (Medusa1, L543.1) |
| |
|
*Data sources: QC1DB: QC1 database; LOCAL: local data source
|
Plot 1
scores: not implemented
| | data source: | giraffe_simlamp
(QC1 database) |
| dataset: | ins_temp53_val | • |
| average: | none |
| thresholds: | none |
| N_data plotted: | 181 |
| [click plot for closeup] |
Plot 2
scores:  9| 9|
| | data source: | giraffe_simlamp
(QC1 database) |
| dataset: | mean_xdiff | + |
| average: | none |
| fixed thresholds: | -1.0...5 | px |
| N_data plotted: | 91 |
| [click plot for closeup] |
Plot 3
scores: 8|
| | data source: | giraffe_simlamp
(QC1 database) |
| dataset: | mean_xdiff | + |
| average: | none |
| fixed thresholds: | -6...0 | px |
| N_data plotted: | 90 |
| [click plot for closeup] |
Plot 4
scores: not implemented
| | data source: | giraffe_simlamp
(QC1 database) |
| dataset: | ins_temp53_val | • |
| average: | none |
| thresholds: | none |
| N_data plotted: | 181 |
| [click plot for closeup] |
Plot 5
scores: 9|
| | data source: | giraffe_simlamp
(QC1 database) |
| dataset: | mean_ydiff | Δ |
| average: | none |
| fixed thresholds: | -1...3.0 | px |
| N_data plotted: | 91 |
| [click plot for closeup] |
Plot 6
scores: 8|
| | data source: | giraffe_simlamp
(QC1 database) |
| dataset: | mean_ydiff | Δ |
| average: | none |
| fixed thresholds: | -3.5...1.5 | px |
| N_data plotted: | 90 |
| [click plot for closeup] |
Plot 7
scores: not implemented
| | data source: | giraffe_simlamp
(QC1 database) |
| dataset: | ins_temp53_val | + |
| average: | none |
| thresholds: | none |
| N_data plotted: | 91 |
| [click plot for closeup] |
Plot 8
scores: not implemented
| | data source: | giraffe_simlamp
(QC1 database) |
| dataset: | ins_temp53_val | + |
| average: | none |
| thresholds: | none |
| N_data plotted: | 90 |
| [click plot for closeup] |
Plot 9
scores: not implemented
| | data source: | giraffe_simlamp
(QC1 database) |
| dataset: | ins_temp53_val | Δ |
| average: | none |
| thresholds: | none |
| N_data plotted: | 91 |
| [click plot for closeup] |
Plot 10
scores: not implemented
| | data source: | giraffe_simlamp
(QC1 database) |
| dataset: | ins_temp53_val | Δ |
| average: | none |
| thresholds: | none |
| N_data plotted: | 90 |
| [click plot for closeup] |
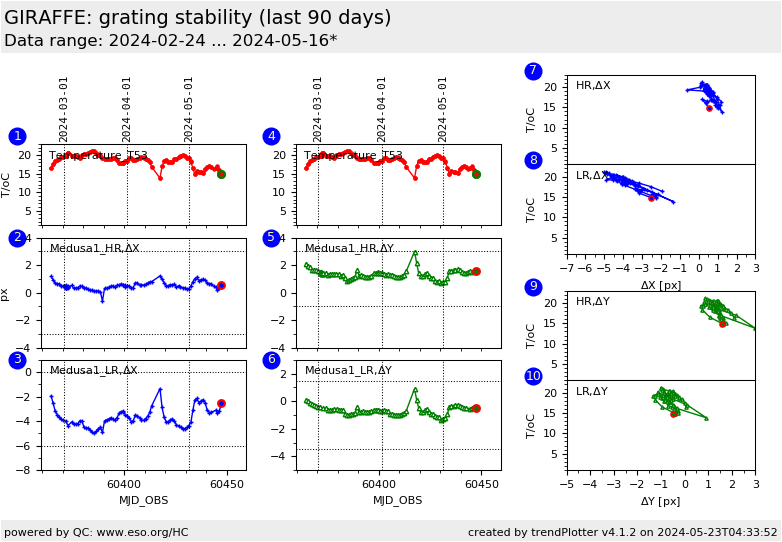
This is the trending plot monitoring the stability of the GIRAFFE high-resolution and low-resolution grating.
It measures the thermal and non-thermal drifts of the gratings.
These data are derived from the daily SIMLAMP,TAL health check measurements
(HR grating: H525.8B setting; LR grating: L543.1).
Panel 1 (plots 1-3), top to bottom:
- plot 1: temperature T53
- plot 2: Medusa1, differential drift DX (in pix) against a reference frame, HR
grating
- plot 3: same, for LR grating.
Panel 2 (plots 4-6). Same as panel 1, for shifts in Y direction. The
T53 plot is repeated.
Plots 7,8: Correlation plots DT vs. DX.
The thermal drifts show up as diagonal clustering (upper left to lower right).
Any systematic deviation is due to a non-thermal effect.
Plots 9,10: same for DT vs. DY.
Find more information here.
General information
Click on any of the plots to see a close-up version.
The latest date is indicated on top of the plot.
If configured,
- data points belonging to the latest date are specially marked
- statistical averages are indicated by a solid line, and thresholds by broken lines
- outliers are marked by a red asterisk. They are defined as data points outside the
threshold lines
- "aliens" (= data points outside the plot Y limits) are marked by a red arrow (↑ or ↓)
- you can download the data for each parameter set if the 'Data downloads' link shows up
|
