Plot
? |
Symb
? |
Source
* |
Average ? |
Thresholds ? |
N_
data |
QC1
parameter |
Data
downloads |
Remarks |
| method |
value |
unit |
method |
value |
| 1 |
• | QC1DB |
MEDIAN |
4.85 |
pixels |
VAL | 4.6,5.8 |
37 |
mean_width |
this |
last_yr |
all
|
mean width of fibre signal, L543.1 setting; Medusa1 |
| 2 |
+ | QC1DB |
MEDIAN |
4.88 |
pixels |
VAL | 4.6,5.8 |
32 |
mean_width |
this |
last_yr |
all
|
as plot 1, Medusa2 |
| 4 |
∗ | QC1DB |
MEDIAN |
2.66 |
pixels |
VAL | 2.2,3.2 |
13 |
mean_width |
this |
last_yr |
all
|
as plot 1, IFU1 |
| 5 |
▲ | QC1DB |
MEDIAN |
2.62 |
pixels |
VAL | 2.2,3.2 |
14 |
mean_width |
this |
last_yr |
all
|
as plot 1, IFU2 |
| 6 |
• | QC1DB |
MEDIAN |
2.57 |
pixels |
VAL | 2.2,3.2 |
20 |
mean_width |
this |
last_yr |
all
|
as plot 1, Argus |
| |
|
*Data sources: QC1DB: QC1 database; LOCAL: local data source
|
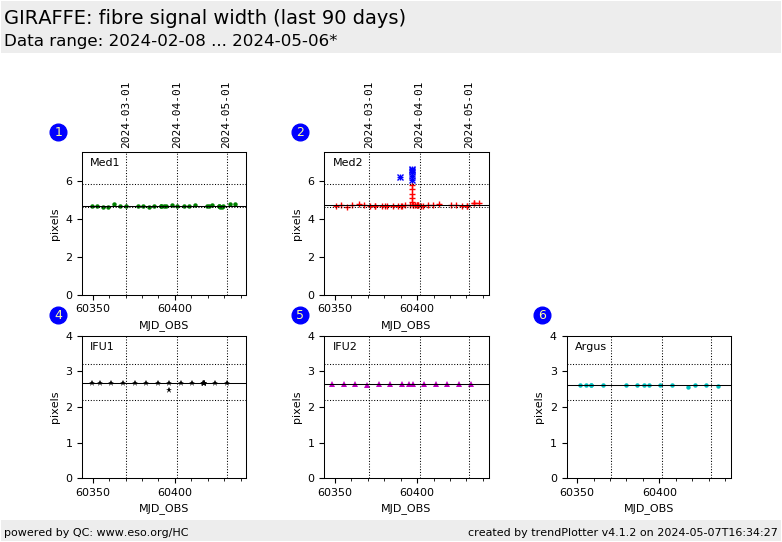
Plot 1
scores:  6| 6|
| | data source: | giraffe_flat
(QC1 database) |
| dataset: | mean_width | • |
| median: | 4.85 | pixels |
| fixed thresholds: | 4.6...5.8 | pixels |
| N_data plotted: | 37 |
| [click plot for closeup] |
Plot 2
scores: 2|
| | data source: | giraffe_flat
(QC1 database) |
| dataset: | mean_width | + |
| median: | 4.88 | pixels |
| fixed thresholds: | 4.6...5.8 | pixels |
| N_data plotted: | 32 |
| [click plot for closeup] |
Plot 4
scores: 2|
| | data source: | giraffe_flat
(QC1 database) |
| dataset: | mean_width | ∗ |
| median: | 2.66 | pixels |
| fixed thresholds: | 2.2...3.2 | pixels |
| N_data plotted: | 13 |
| [click plot for closeup] |
Plot 5
scores: 2|
| | data source: | giraffe_flat
(QC1 database) |
| dataset: | mean_width | ▲ |
| median: | 2.62 | pixels |
| fixed thresholds: | 2.2...3.2 | pixels |
| N_data plotted: | 14 |
| [click plot for closeup] |
Plot 6
scores: 2|
| | data source: | giraffe_flat
(QC1 database) |
| dataset: | mean_width | • |
| median: | 2.57 | pixels |
| fixed thresholds: | 2.2...3.2 | pixels |
| N_data plotted: | 20 |
| [click plot for closeup] |
This is the Health Check plot for the width of the fibre signal in the GIRAFFE
flat field calibration data. We display the QC1 parameter mean_width
as derived from the pipeline product FF_LOCWIDTH. This plot monitors the L543.1
HC flat data only.
The purpose of this plot is to monitor the spectral format as well as the
pipeline recipe gimasterflat. The currently used limits are purely empirical
and are meant to flag outliers.
Note that all data for 2006-09 and earlier were calculated with a different
algorithm and are smaller.
General information
Click on any of the plots to see a close-up version.
The latest date is indicated on top of the plot.
If configured,
- data points belonging to the latest date are specially marked
- statistical averages are indicated by a solid line, and thresholds by broken lines
- outliers are marked by a red asterisk. They are defined as data points outside the
threshold lines
- "aliens" (= data points outside the plot Y limits) are marked by a red arrow (↑ or ↓)
- you can download the data for each parameter set if the 'Data downloads' link shows up
|
