Plot
? |
Symb
? |
Source
* |
OPS?
** |
Average ? |
Thresholds ? |
N_
data |
QC1
parameter |
Data
downloads |
Remarks |
| method |
value |
unit |
method |
value |
| 1 |
• | QC1DB |
no |
MEDIAN |
8.1e+03 |
ADU/sec |
VAL | 6000,55000 |
87 |
lamp_eff |
this |
last_yr |
all
|
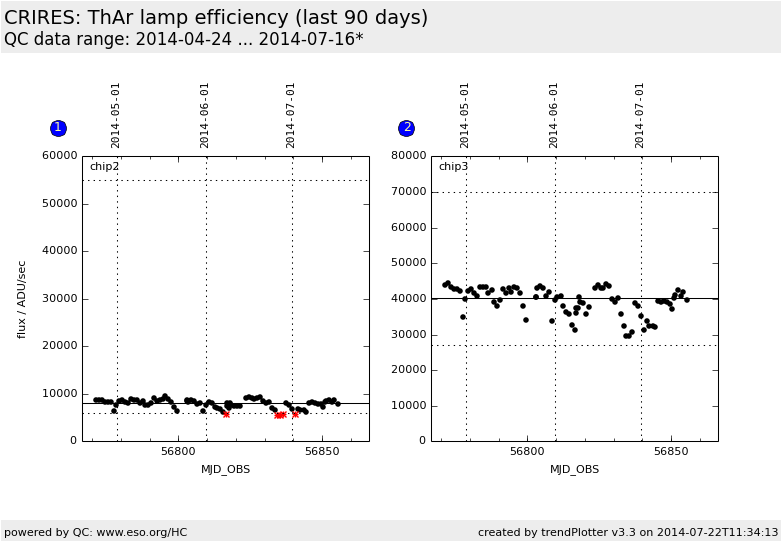
lamp efficiency (flux) on chip 2, WREF=1090.4 |
| 2 |
• | QC1DB |
no |
MEDIAN |
4.01e+04 |
ADU/sec |
VAL | 27000,70000 |
87 |
lamp_eff |
this |
last_yr |
all
|
lamp efficiency (flux) on chip 3, WREF=1090.4 |
| |
|
*Data sources: QC1DB: QC1 database; LOCAL: local text file | **OPS: OPSLOG data are included
|
Plot 1
scores:  8| 8|
| | data source: | crires_wave
(QC1 database) |
| dataset: | lamp_eff | • |
| median: | 8.1e+03 | ADU/sec |
| fixed thresholds: | 6000...55000 | ADU/sec |
| N_data plotted: | 87 |
| [click on plot for closeup] |
Plot 2
scores: 8|
| | data source: | crires_wave
(QC1 database) |
| dataset: | lamp_eff | • |
| median: | 4.01e+04 | ADU/sec |
| fixed thresholds: | 27000...70000 | ADU/sec |
| N_data plotted: | 87 |
| [click on plot for closeup] |
Lamp efficiency: flux of ThAr lamp.
The lamp efficiency for the ThAr lamp is monitored using the daily health check
setting with reference wavelength (on chip 3) of 1090.4nm.
It is the total flux between y=120 and y=170 on each detector. This area
should normally contain one fibre trace with ThAr lines.
As there is
strong vignetting and contamination from adjacent orders on chips 1 and 4,
only the results for chips 2 and 3 are plotted.
General information
Click on any of the plots to see a close-up version.
The latest date is indicated on top of the plot, data points belonging to that date are specially marked.
If configured,
- statistical averages are indicated by a solid line, and thresholds by broken lines
- outliers are marked by a red asterisk. They are defined as data points outside the
threshold lines
- "aliens" (= data points outside the plot Y limits) are marked by a red arrow (↑ or ↓)
- you can download the data for each parameter set if the 'Data downloads' link shows up
|

