Plot
? |
Symb
? |
Source
* |
Average ? |
Thresholds ? |
N_
data |
QC1
parameter |
Data
downloads |
Remarks |
| method |
value |
unit |
method |
value |
| 1 |
• | QC1DB |
none |
|
NONE |
none | |
12 |
throughput |
this |
last_yr |
all
|
Throughput, wlen_id=Y1028, AVG |
| 2 |
• | QC1DB |
none |
|
NONE |
none | |
12 |
throughput |
this |
last_yr |
all
|
Throughput, wlen_id=J1228, AVG |
| 3 |
• | QC1DB |
none |
|
NONE |
none | |
12 |
throughput |
this |
last_yr |
all
|
Throughput, wlen_id=H1567, AVG |
| 4 |
• | QC1DB |
none |
|
NONE |
none | |
12 |
throughput |
this |
last_yr |
all
|
Throughput, wlen_id=K2148, AVG |
| 5 |
• | QC1DB |
none |
|
NONE |
none | |
11 |
throughput |
this |
last_yr |
all
|
Throughput, wlen_id=L3377, AVG |
| 6 |
• | QC1DB |
none |
|
NONE |
none | |
13 |
throughput |
this |
last_yr |
all
|
Throughput, wlen_id=M4266, AVG |
| |
|
*Data sources: QC1DB: QC1 database; LOCAL: local data source
|
Plot 1
scores: not implemented
| | data source: | criresp_std
(QC1 database) |
| dataset: | throughput | • |
| average: | none |
| thresholds: | none |
| N_data plotted: | 12 |
| [click plot for closeup] |
Plot 2
scores: not implemented
| | data source: | criresp_std
(QC1 database) |
| dataset: | throughput | • |
| average: | none |
| thresholds: | none |
| N_data plotted: | 12 |
| [click plot for closeup] |
Plot 3
scores: not implemented
| | data source: | criresp_std
(QC1 database) |
| dataset: | throughput | • |
| average: | none |
| thresholds: | none |
| N_data plotted: | 12 |
| [click plot for closeup] |
Plot 4
scores: not implemented
| | data source: | criresp_std
(QC1 database) |
| dataset: | throughput | • |
| average: | none |
| thresholds: | none |
| N_data plotted: | 12 |
| [click plot for closeup] |
Plot 5
scores: not implemented
| | data source: | criresp_std
(QC1 database) |
| dataset: | throughput | • |
| average: | none |
| thresholds: | none |
| N_data plotted: | 11 |
| [click plot for closeup] |
Plot 6
scores: not implemented
| | data source: | criresp_std
(QC1 database) |
| dataset: | throughput | • |
| average: | none |
| thresholds: | none |
| N_data plotted: | 13 |
| [click plot for closeup] |
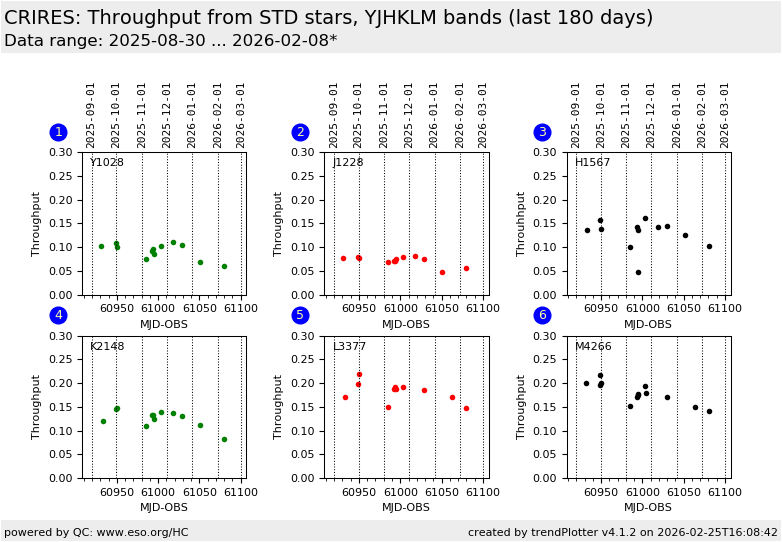
Trending plot for the instrument throughput determined from the
CRIRES+ spectro-photometric stanadrd star exposures. The throughput
averaged over all CHIPs is monitored, within 6 wavelength bands (INS.WLEN.ID):
- Y1028, 1027.632 nm
- J1228, 1228.488 nm
- H1567, 1569.099 nm
- K2148, 2147.646 nm
- L3377, 3376.965 nm
- M4266, 4265.706 nm
General information
Click on any of the plots to see a close-up version.
The latest date is indicated on top of the plot.
If configured,
- data points belonging to the latest date are specially marked
- statistical averages are indicated by a solid line, and thresholds by broken lines
- outliers are marked by a red asterisk. They are defined as data points outside the
threshold lines
- "aliens" (= data points outside the plot Y limits) are marked by a red arrow (↑ or ↓)
- you can download the data for each parameter set if the 'Data downloads' link shows up
|
